Sep 5, 2019
With fears of a recession on the rise, investors are looking for any potential signs of cracks in the economic picture. Tuesday’s ISM Manufacturing report, which showed the first contraction in the manufacturing sector in a couple of years, was one of those signs, but the stronger than expected report from the ISM Services report earlier today helped to allay those concerns. When it comes to the market, trade talks, or economic data, lately it seems like we’re simply running in place. For every good market day, tweet, or economic report, it seems as though there is a negative one to offset it. Today’s rally in equities looks to be an attempt by the market to break out of the rut it has been in, so will tomorrow’s payrolls report start another positive streak for the economy?
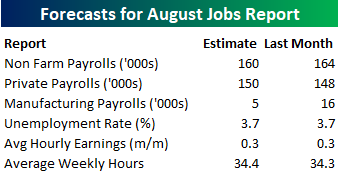
Heading into tomorrow’s report, economists are expecting an increase in payrolls of 160K, which would be a slight decline from July’s reading of 164K. In the private sector, economists are actually expecting a slight increase from July to 150K from 148K. Not surprisingly, job growth in the Manufacturing sector is expected to slow from 16K from 5K. The unemployment rate is expected to remain unchanged at 3.7%, average hourly earnings growth is expected to remain at 0.3%, and average weekly hours are expected to increase to 34.4 from 34.3.
Ahead of the report, we just published our eleven-page preview of the August jobs report. This report contains a ton of analysis related to how the equity market has historically reacted to the monthly jobs report, as well as how secondary employment-related indicators we track looked in August. We also include a breakdown of how the initial reading for August typically comes in relative to expectations and how that ranks versus other months.
For anyone with more than a passing interest in how equities are impacted by economic data, this August employment report preview is a must-read. To see the report, sign up for a monthly Bespoke Premium membership now!
Aug 29, 2019
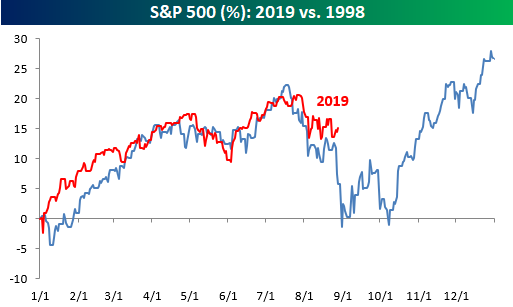
We’ve highlighted the chart below comparing 2019 to 1998 a number of times over the last several weeks, and the similarities between the performance of the S&P 500 in each year has continued right up through the end of August. While the pullback from the highs this Summer hasn’t been as severe as it was in 1998, the timing of both and the subsequent periods of backing and filling has been striking. A continuation of the similar patters certainly wouldn’t be a positive in the short term, but the silver lining is that Q4 1998 was exceptionally strong.
As we do throughout the year, in our most recent B.I.G. Tips report we compared the S&P 500’s trading pattern this year to all other years in order to see which ones were the most similar. With those similar years, we then analyzed how the S&P 500 performed for the remainder of the year in order to help come up with a framework for what to expect for the rest of this year. It shouldn’t surprise anyone that 1998 made the list, but a number of other notable years also had strong similarities to the pattern of 1998 with very different outcomes as well.
For anyone with more than a passing interest in the market’s seasonal patterns, this report is a must-read. To see it, sign up for a monthly Bespoke Premium membership now!
Aug 20, 2019
Our Seasonality tool is a great way for investors and traders to gauge seasonal patterns for both the overall market and individual stocks. In the tool, users can create custom screens for different time periods to see which stocks have performed the best and worst over a given time period. At the top of the tool each day, we include gauges like the one below which shows the S&P 500’s median historical performance over the upcoming week, month, and quarter. When the reading on the gauge is low, it indicates that the upcoming week, month, or quarter ranks near the bottom relative to all other similar periods throughout the year, while higher readings indicate that the performance ranks high relative to all other periods.
As shown in the current one-week gauge, seasonal patterns suggest that the upcoming week isn’t one of the best weeks of the year. Over the last ten years, the S&P 500’s median return of 0.07% ranks in just the 38th percentile relative to all other one week periods. While still a positive return, the performance is nothing to write home about.

While the upcoming week has been a period of ho-hum returns for the market, the upcoming one and three month periods have historically been much closer to extremes relative to all other periods, and in our latest B.I.G. Tips report, we provided a detailed look at market seasonality in the upcoming one and three month periods. In it, we have also included a look at which ETFs have historically followed and bucked the seasonal trend during this period.
For anyone with more than a passing interest in the market’s seasonal patterns, this report is a must-read. To see it, sign up for a monthly Bespoke Premium membership now!
Aug 9, 2019
We’ve just published a B.I.G. Tips report that provides a full summary of the ongoing earnings season along with the newest edition of our Top Triple Plays. This season we identified 22 earnings triple plays that have attractive price charts right now.
What is a triple play? When a stock reports quarterly earnings, it registers a “triple play” when it beats analyst EPS estimates, beats analyst revenue estimates, and raises forward guidance. We coined the term back in the mid-2000s, and you can read more about it at Investopedia.com. We consider triple plays to be the cream of the crop of earnings season, and we’re constantly finding new long-term buy opportunities from this basket of names each quarter. You can track the newest earnings triple plays on a daily basis at our Triple Plays page if you’re a Bespoke Premium or Bespoke Institutional member.
To read our newest report and see the triple plays that we think look the best right now, start a two-week free trial to Bespoke Premium!
