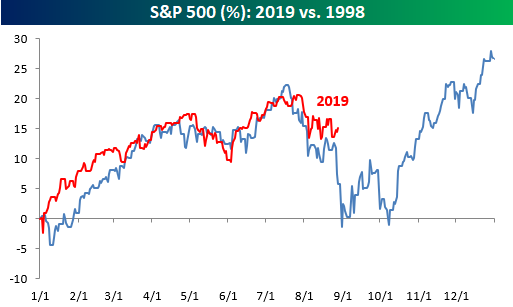
We’ve highlighted the chart below comparing 2019 to 1998 a number of times over the last several weeks, and the similarities between the performance of the S&P 500 in each year has continued right up through the end of August. While the pullback from the highs this Summer hasn’t been as severe as it was in 1998, the timing of both and the subsequent periods of backing and filling has been striking. A continuation of the similar patters certainly wouldn’t be a positive in the short term, but the silver lining is that Q4 1998 was exceptionally strong.
As we do throughout the year, in our most recent B.I.G. Tips report we compared the S&P 500’s trading pattern this year to all other years in order to see which ones were the most similar. With those similar years, we then analyzed how the S&P 500 performed for the remainder of the year in order to help come up with a framework for what to expect for the rest of this year. It shouldn’t surprise anyone that 1998 made the list, but a number of other notable years also had strong similarities to the pattern of 1998 with very different outcomes as well.
For anyone with more than a passing interest in the market’s seasonal patterns, this report is a must-read. To see it, sign up for a monthly Bespoke Premium membership now!
