B.I.G,. Tips – US Economic Indicator Diffusion Index Bounces
This content is for members onlyRetail Sales Inline, But Big Upside Revisions
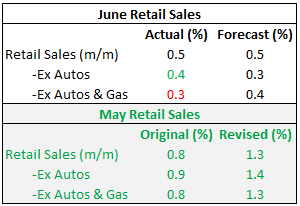
When it comes to the June Retail Sales report, it has historically been pretty weak relative to expectations. Since the expansion began in 2009, there have only been three better than expected June reports out of nine. Even worse, heading into today’s report, five out of the last six June Retail Sales reports were weaker than expected. Based on that record, the fact that today’s report for June was inline with expectations at the headline level is almost considered a win! Ex Autos, the report was even stronger than expected, while Ex Autos & Gas, it was weaker. So there was a little of everything. What was really impressive about the June report was the half percentage point upside revisions to May (see table to right). The last time the report had a larger upside revision to the initial report was almost a year ago last August.
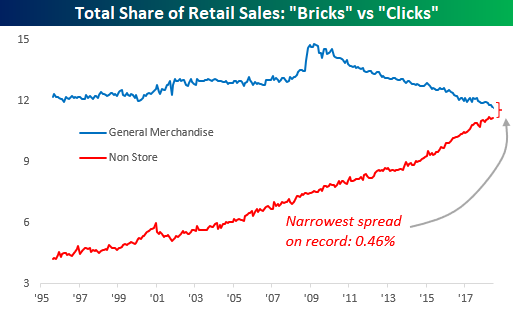
Another interesting trend involving this month’s report was the ongoing shift from “Bricks to Clicks” and “Death By Amazon” which we have been highlighting for years now. Following June’s report, we are increasingly reaching the point where Online’s share of total sales will overtake the General Merchandise category, as the spread of less than 0.5% between the two sector’s shares was the narrowest on record. That’s quite a difference from 20 years ago when General Merchandise was at 12% and Online was under 5%.
In a just-published report for Premium and Institutional clients, we provided a complete analysis of this month’s Retail Sales reports and how recent shifts have impacted overall trends. To unlock this report, sign up for a Bespoke Premium trial membership now!
Years Like 2018 – Not Many!
Calling a specific period of time “unique” is often used as a cop-out by commentators and investors, so we usually try not use the term lightly. But if a certain period of time is so unique that it has no historical precedent, you can’t fault someone for saying it. In comparing the S&P 500’s performance in 2018 to prior years, we found that there really are very few years where the market has seen a similar pattern. In other words, 2018 really is unique!
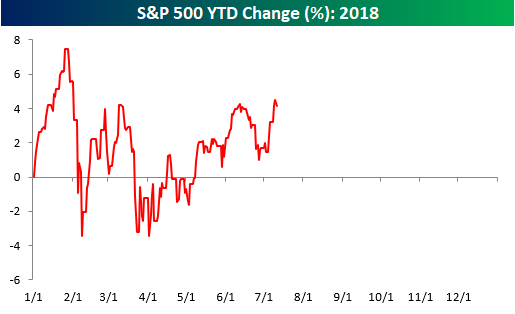
To illustrate this, we ran the correlation of the closing prices of the S&P 500 so far this year to the closing prices for every other year through 7/11. We have done this type of analysis many times over the years, and usually, when we run it, the years that have the most similarity to the year in question have correlation coefficients of +0.85 or even greater than 0.90. In the analysis we ran for 2018, however, there were only two years with a correlation coefficient of more than +0.50, and five of the top ten years have correlation coefficients of less than +0.40!
In a just-published report for Premium and Institutional clients, we ran an analysis of the years that were the most positively and negatively correlated to 2018 to see what trends the market showed for the remainder of these years. To unlock this report, sign up for a Bespoke Premium trial membership now!
B.I.G. Tips – Analysts Cautiously Pessimistic
Earnings season kicks off this week as the first of the major companies start to report Q2 numbers. Most of the big names reporting are Financials like Citigroup (C), JPMorgan Chase (JPM), PNC, and Wells Fargo (WFC), which all report on Friday morning. Besides these names, the only non-Financials of note are Pepsi (PEP) on Tuesday morning and Delta (DAL) before the open on Thursday.
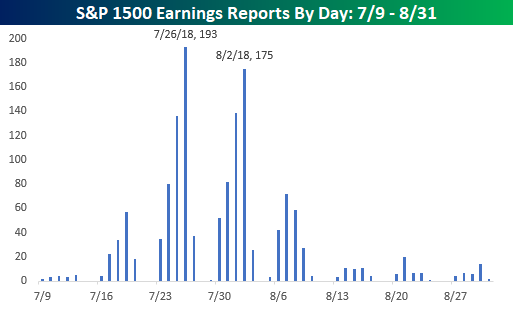
The pace of reports picks up next week when 135 companies in the S&P 1500 are expected to report, but the peak period of earnings season will be in the two weeks that follow as more than 950 companies are scheduled to report. That’s nearly two-thirds of the entire index in just two weeks! The busiest day during that period will be on 7/26 when 193 companies in the S&P 1500 are expected to report in a single day, while the second busiest day of earnings season is one week later on 8/2 when another 175 companies will report. For a more detailed rundown of the earnings schedule for the upcoming season, please see our Interactive Earnings Calendar, and to prepare for how individual companies tend to react to earnings, check out our Earnings Screener (available to all Institutional clients).
We just published our quarterly look at analyst EPS revisions heading into this earnings season. In this report, we look to see if analysts are bullish or bearish on earnings for the upcoming quarter. Analyst sentiment at the start of earnings season has historically had a big impact on the stock market’s performance.
This report is a must-read. To see it, sign up for a Bespoke Premium membership now!
B.I.G. Tips – June Employment Report Preview
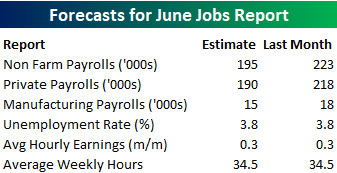
Heading into Friday’s Non-Farm Payrolls (NFP) report for June, economists are expecting an increase in payrolls of 195K, which would be a modest decline from May’s solid reading of 223K. In the private sector, economists are expecting an increase of 195K. With these increases, the unemployment rate is expected to remain low at 3.8%. An added area of focus, however, will come from average hourly earnings as inflation worries weigh on investor sentiment. Any stronger than expected reading in wage measures will likely be viewed as a negative for the market
Ahead of the report, we just published our eleven-page preview of the June jobs report. This report contains a ton of analysis related to how the equity market has historically reacted to the monthly jobs report, as well as how secondary employment-related indicators we track looked in June. We also include a breakdown of how the initial reading for June typically comes in relative to expectations and how that ranks versus other months.
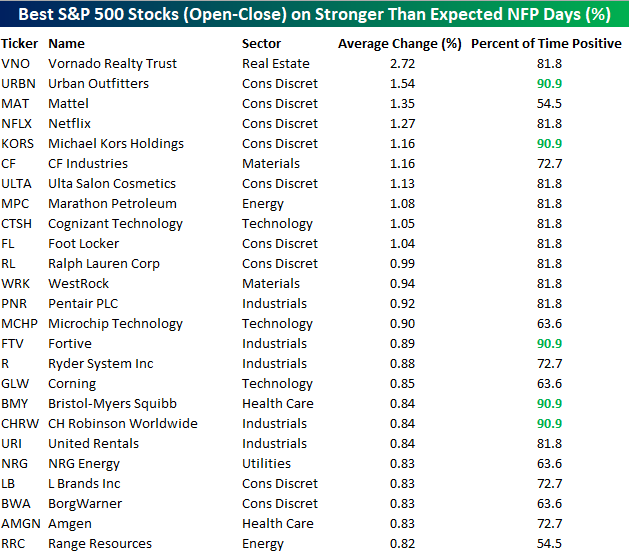
One topic we cover in each month’s report is the S&P 500 stocks that do best and worst from the open to close on the day of the employment report based on whether or not the report comes in stronger or weaker than expected. In other words, which stocks should you buy, and which should you avoid? The table below highlights the best-performing stocks in the S&P 500 from the open to close on days when the Non-Farm Payrolls report has been better than expected over the last two years.
Of the 25 top performing stocks on days when the NFP beats expectations, eight sectors are represented, and Consumer Discretionary leads the way with nine. Vornado (VNO) has been the best performing stock with an average open to close gain of 2.72%. VNO is followed by nine other stocks that have been up over 1%. In terms of consistency, Urban Outfitters (URBN), Michael Kors (KORS), Fortive (FTV), Bristol Myers (BMY), and CH Robinson (CHRW) have all been positive 90% of the time.
For anyone with more than a passing interest in how equities are impacted by economic data, this report is a must-read. To see the report, sign up for a monthly Bespoke Premium membership now!