Calling a specific period of time “unique” is often used as a cop-out by commentators and investors, so we usually try not use the term lightly. But if a certain period of time is so unique that it has no historical precedent, you can’t fault someone for saying it. In comparing the S&P 500’s performance in 2018 to prior years, we found that there really are very few years where the market has seen a similar pattern. In other words, 2018 really is unique!
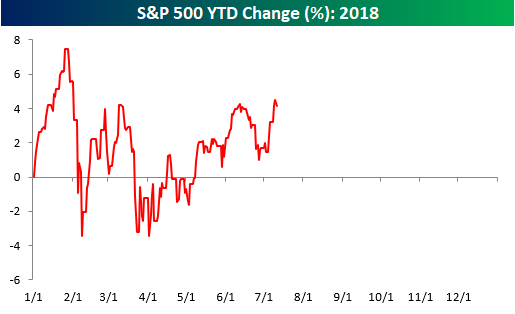
To illustrate this, we ran the correlation of the closing prices of the S&P 500 so far this year to the closing prices for every other year through 7/11. We have done this type of analysis many times over the years, and usually, when we run it, the years that have the most similarity to the year in question have correlation coefficients of +0.85 or even greater than 0.90. In the analysis we ran for 2018, however, there were only two years with a correlation coefficient of more than +0.50, and five of the top ten years have correlation coefficients of less than +0.40!
In a just-published report for Premium and Institutional clients, we ran an analysis of the years that were the most positively and negatively correlated to 2018 to see what trends the market showed for the remainder of these years. To unlock this report, sign up for a Bespoke Premium trial membership now!
