Mar 31, 2022
The last couple weeks of the first quarter have seen equities reverse a sizable portion of this year’s losses and sentiment has rebounded in sync, though, bullish sentiment turned slightly lower this week in spite of the S&P 500’s move higher. From the weekly AAII sentiment survey, bullish sentiment shed 0.9 percentage points coming in at 31.9%. Even after that decline, the current level of reported optimism remains above all others (outside of last week) since early January, but bullish sentiment still would need to rise another 6 percentage points to move back up to its historical average.

While more investors are not reporting much optimism, fewer are outright bearish. Bearish sentiment fell for a second week in a row falling another 7.9 percentage points to 27.5%. With a little over a quarter of respondents reporting as bearish, this sentiment reading is at the lowest level since November. That is also now the biggest two-week decline in bearish sentiment (22.3 percentage points) since November 2009 when it had fallen 23.74 percentage points in a two-week span.

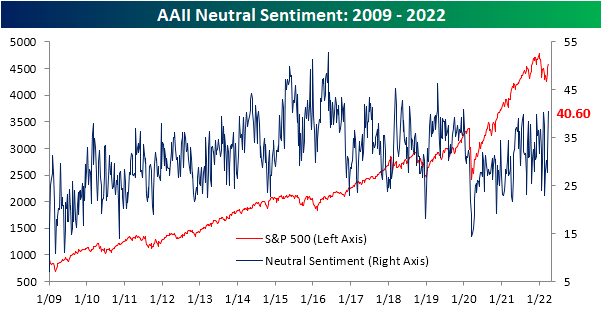
Finally, we would note that given bearish sentiment has plummeted at a historic rate without much of an increase in bullish sentiment, neutral sentiment has picked up the difference. That reading clipped above 40% this week for the highest level since January 2020.
Other sentiment surveys like the Investors Intelligence one and NAAIM’s Exposure Index have also pivoted more bullish this week. As a result, our sentiment composite is close to zero meaning across these three indicators, sentiment is now only just slightly below the historical average. Click here to view Bespoke’s premium membership options.

Mar 31, 2022
Whereas last week’s release of initial jobless claims set a new multi-decade low, this week that number was revised up by 1K. That means last week’s revised reading of 188K matched the December low. Turning to this week, claims came off that low rising 14K. Albeit higher, at 202K initial claims remain at historically strong levels.

On a non-seasonally adjusted basis, claims had another sub-200K showing after rising 13.2K week over week. In terms of seasonality, the current week of the year has historically seen unadjusted claims fall sequentially more often than not, and the following couple of weeks have tended to see a seasonal uptick in claims. In other words, we’re likely to see claims rise on account of seasonal factors in the coming weeks.
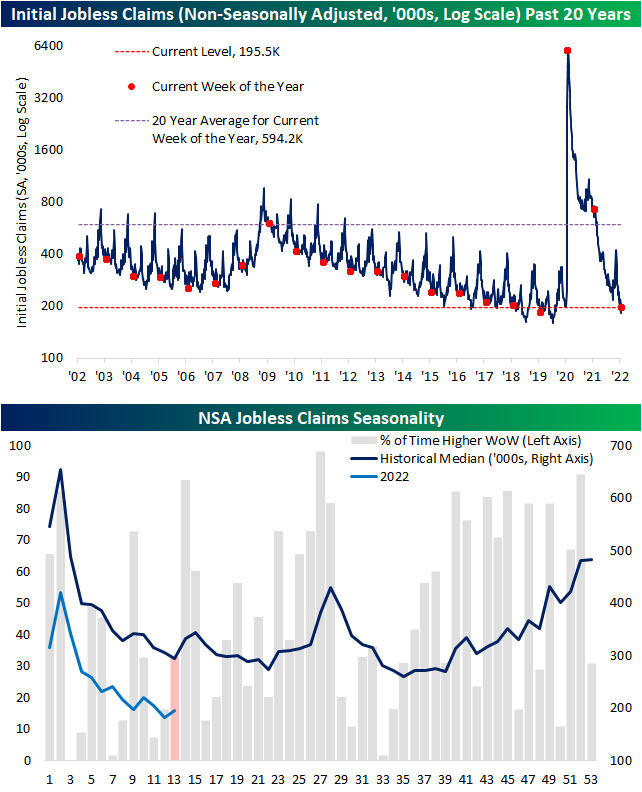
Delayed one week to initial claims, the continuing claims number was the most impressive part of the most recent release. Coming in just above 1.3 million, seasonally adjusted claims hit the lowest level since the final week of 1969. Click here to view Bespoke’s premium membership options.

Mar 30, 2022
Log-in here if you’re a member with access to the Closer.
Looking for deeper insight into markets? In tonight’s Closer sent to Bespoke Institutional clients, we start out tonight’s note with a look at equities’ failed breakout and the factors that drove price action today. We then review today’s final Q4 GDP numbers including a look at national income statistics. We then finish with a recap of the latest EIA petroleum stockpile data.
See today’s post-market Closer and everything else Bespoke publishes by starting a 14-day trial to Bespoke Institutional today!
Mar 30, 2022
While the index turned lower today on weaker breadth, the recent rally for the S&P 500 has come on strong breadth resulting in the 10-day advance/decline line to surge to some of the highest readings on record. Monday and Tuesday saw 99th percentile readings in the 10-day A/D line and even after the decline today, the current reading remains in the 96th percentile. At Monday’s high, the 10-day AD line reached the most elevated level since October 2020. On a sector level, in the past week Financials, Health Care, Materials, Real Estate, and Tech also all saw 99th percentile readings in their own 10-day advance-decline lines.

In the matrix below, we show the average forward performance of the S&P 500 broken down by the percentile range that the index’s 10-day AD line is in. Generally, lower readings in the 10-day AD line have been followed by stronger returns whereas higher readings have been followed by weaker returns. That is, except for the most elevated readings. Readings in the upper decile have actually been followed by more consistently positive and stronger than normal average returns for the S&P 500. In other words, strong breadth is typically a more negative signal for the S&P 500 going forward, but an extremely strong breadth reading has actually been positive.
