Jun 16, 2022
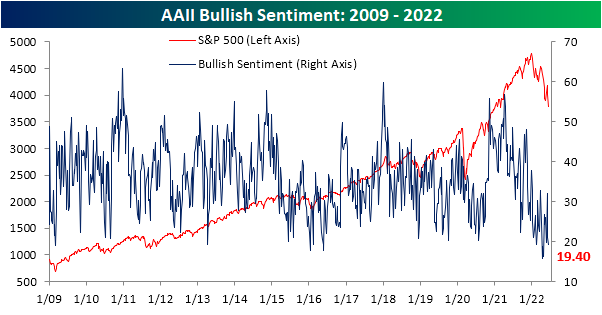
More hawkish monetary policy and the S&P 500 hitting the bear market threshold have given sentiment plenty of reason to turn lower, and that’s exactly what has happened. After reaching a short-term high of 32% only two weeks ago, the percentage of respondents to the AAII survey considering themselves bullish has fallen back below 20% this week. That may not be as extreme of reading as those in the mid-teens from back in April, but, it is still a historically low reading and in the bottom 2% of all weeks going back to the start of the survey in 1987.
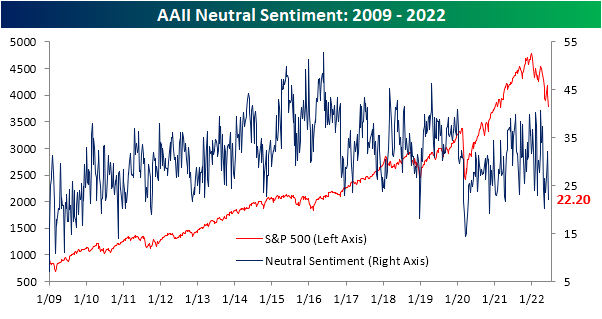
While bullish sentiment has declined, this week’s 1.6 percentage point decline was actually much smaller than the 11 percentage point drop last week. An even bigger decline occurred for those reporting neutral sentiment. That reading fell 9.9 percentage points from a recent high of 32.1%. Now at 22.2%, the percentage of neutral respondents is back down to the lowest level since the start of May.
With both bullish and neutral sentiment falling, the bearish camp picked up the difference. Heading into this week, bearish sentiment was already elevated at 46.9%. The 11.4 percentage point bump this week means that well over half of respondents are now bearish with the current reading just 1.1 percentage points shy of the 59.4% high from the end of April. That ranks as the eleventh highest reading of all weeks on record.

That also means the percentage of bears outweighs bulls by an astounding 38.9 percentage points and is the lowest reading since the last week of April.

Not only do bears outweigh bulls by a large margin, but it has also been a historically long length of time that this has been the case. Smoothing out the reading by taking a four-week moving average of the bull-bear spread, the average has been below -10 (in other words on average over a four-week span bearish sentiment has been at least 10 percentage points higher than bullish sentiment) for 21 straight weeks. That surpassed another long 18-week streak in 2020 and is now only five weeks short of the record stretch of 26 weeks in the early 1990s.

Not only has the AAII survey showed souring sentiment, but so too have the weekly NAAIM Exposure Index and the Investors Intelligence surveys. This week, the NAAIM index showed investment managers only have 32.2% long equity exposure. Meanwhile, the Investors Intelligence survey saw the most negative bull-bear spread in a month. Normalizing each of these three sentiment indicators, the average reading is now 1.28 standard deviations from the historical norm. That is not as bad as last month, but it remains a historically pessimistic reading on sentiment. Click here to learn more about Bespoke’s premium stock market research service.

Jun 16, 2022
Jobless claims have been trending higher off of multi-decade lows, indicating a moderating labor market. This week, initial claims would have gone unchanged week over week at 229K if it were not for a modest upward revision to 232K to last week’s number. In other words, claims were little changed this week as they continue to gradually head higher. At these levels, claims remain at the high end of the range from the few years prior to the pandemic.

On a non-seasonally adjusted basis, claims have begun to experience the typical upward swing for this point of the year and that is likely to continue over the next month and change. NSA claims topped 200K this week for the first time since the last week of April which is right in line with the readings from the comparable weeks of the year of 2018 and 2019.

Continuing claims are lagged an additional week to initial claims but this reading has also been making its way off the lows. Granted, the move off the lows for continuing claims has been much more modest than initial claims (only 6K for continuing claims versus 66K for initial). Seasonally adjusted continuing claims rose for the second week in a row this week to 1.312 million which is only the highest level in a month. Click here to learn more about Bespoke’s premium stock market research service.

Jun 15, 2022
Log-in here if you’re a member with access to the Closer.
Looking for deeper insight into markets? In tonight’s Closer sent to Bespoke Institutional clients, we start out by providing commentary on the FOMC’s policy decision and some contradictions offered by Powell (pages 1 & 2). We then show the reaction across assets (page 3). We follow up with an additional note on consumer spending (page 4) before turning to petroleum inventory data (page 5). We finish with a look at the 150 day long streak without an overbought reading in the S&P 500’s 14-day RSI (page 6).

See today’s full post-market Closer and everything else Bespoke publishes by starting a 14-day trial to Bespoke Institutional today!
Jun 15, 2022
The past week has seen the national average for a 30 year fixed rate mortgage once again rocket higher. The average currently sits only a few basis points below 6%, the highest rate since the mid-2000s, as it has risen an astounding 42 basis points versus one week ago. As shown in the second chart below, that is one of only a handful of similar rapid upticks since at least 2000. The most recent of these is March 2020, and prior to that the December 2016 surge came close. Looking further back, only June 2013, the fall of 2008, and September 2003 have seen anywhere close to the same size short-term surges in mortgage rates.

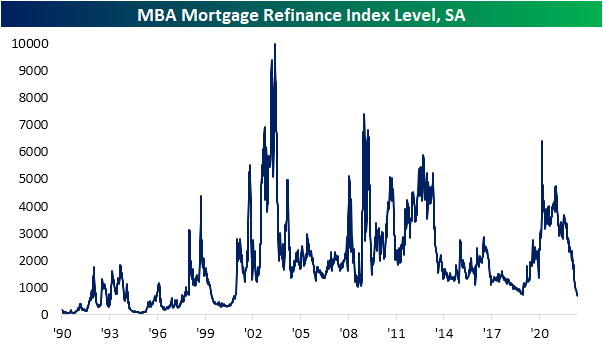
Ironically, weekly data from the Mortgage Bankers Association actually got some relief this week. Seasonally adjusted purchases rose 8% week over week. That was the biggest one-week uptick since March but only brings the index back to levels last seen three weeks ago. Even though this week’s 3.66% increase ended a five-week losing streak, outside of last week, refinance applications are at the lowest level since 2000.

Also on the housing docket today was homebuilder sentiment from the NAHB. This report too shows a souring sentiment on the part of builders as higher prices (through both cost of a home and the cost to finance) dampen demand. Each category is dropping sharply and back in the middle of their ranges from the few years before the pandemic at best. The Future Sales index has gotten hit the hardest as it fell to 61 in June. Outside of the much more dramatic drop at the start of the pandemic in early 2020, such a low reading has not been observed since December 2018.

As quickly as homebuilder sentiment rose to historic heights and then erased its pandemic gains, the same applies to homebuilder stocks. The iShares US Home Construction ETF (ITB) had finally broken out of a sideways range at the end of last year but has consistently grinded lower in the months since then. In the past week alone it has fallen another 11% and failed at last month’s support in the process. That leaves two interesting next areas to watch. The first is only 2% away from current levels and traces back to the fall of 2020. A little further below that, and 5.25% away from current levels, is the pre-pandemic February 2020 peak. Click here to learn more about Bespoke’s premium stock market research service.
