Jul 14, 2022
Jobless claims have continued to rise hitting the highest level since November this week. Claims rose from an unrevised 235K up to 244K this week. With consistent increases in claims over the past few months, the reading has gone from multi-decade lows to levels that would have been the highest since late 2017/early 2018 pre-pandemic.

As we have noted each week recently, the current week of the year has historically marked a seasonal peak in claims. As such, the current week of the year has also seen a sequential rise in claims 80% of the time including a rise this week. NSA claims now are at 241.3K which is inline with the comparable readings for the three years prior to the pandemic. Although part of the recent increase in claims is likely seasonal in nature, given evidence of a slowing economy including weakness in other labor market data like under the hood of Friday’s nonfarm payrolls report, how much that seasonal uptick unwinds in the weeks ahead will be something to watch.

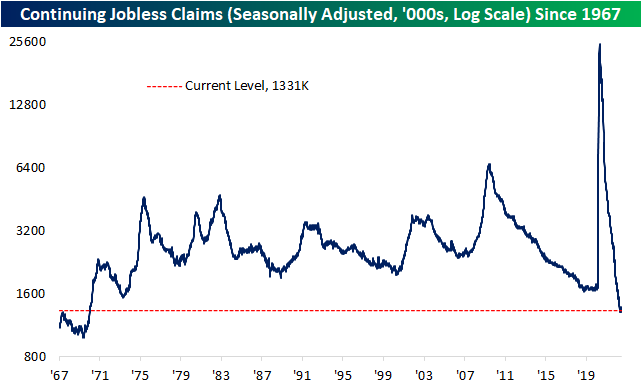
As for continuing claims, there has not been as notable of an increase recently when compared to initial claims. Continuing claims have only risen marginally from the low of 1.306 million in the week of May 20th to 1.331 million in the most recent reading as of July 1st. That most recent reading also saw a sizable improvement from the prior week with claims falling from 1.372 million. Click here to learn more about Bespoke’s premium stock market research service.
Jul 13, 2022
Log-in here if you’re a member with access to the Closer.
Looking for deeper insight into markets? In tonight’s Closer sent to Bespoke Institutional clients, we begin tonight by taking a look at how there is a bullwhip effect impacting the economy and how monetary policy is playing its role in that effect (page 1). We then dive into the huge drop in our quantitative assessment of the Beige Book (page 2). Next, we recap the June update of the federal government’s budget statement (page 3), the drivers of inflation (page 4), and Canadian policy rates (page 5). We finish with a recap of the 30 year bond auction (page 6) and the latest EIA data (page 7).

See today’s full post-market Closer and everything else Bespoke publishes by starting a 14-day trial to Bespoke Institutional today!
Jul 13, 2022
Over the past few days, equities, including the most heavily shorted stocks, have reversed a good amount of the gains seen since the mid-June lows. A basket of the 100 most heavily shorted stocks in the Russell 3,000 is currently little changed versus its levels at the start of 2020 compared to a roughly 16% gain for the Russell 3000. Whereas heavily shorted stocks saw massive outperformance versus the broader market in the second half of 2020 and early 2021, that outperformance has unwound since last fall. More recently over the past two months, though, highly shorted stocks and the Russell 3000 have been performing more or less in line with each other as the relative strength line has trended sideways and is near similar levels to the COVID Crash.

The most recent short interest data as of the end of June was also updated in the past 24 hours. For the whole of the Russell 3000, the average reading on short interest as a percentage of float currently stands at 6.24%. That is up 20 basis points since the prior update for mid-June and a full percentage point higher versus the start of the year.
Across nearly all industry groups, there have been major shifts in short interest levels since the start of the year. While most have made considerable moves higher, there are others that have actually fallen significantly like Food & Staples Retail and Telecommunication Services. Given the big increases this year, Retail continues to have the highest average reading on short interest followed by the Pharmaceuticals, Biotech &Life Sciences, and the automobile industries. Although their levels of short interest are not as elevated, Software & Services and Energy stocks saw the largest increases from the last report while only the Media & Entertainment industry and Food & Staples Retailing stocks saw declines in average short interest between the two most recent reports. That being said, none of those sequential moves were particularly large with the biggest absolute move being the 0.45 percentage point increase in Software & Services.

Switching over to the individual stocks with the highest levels of short interest, Dillard’s (DDS) currently tops the list with a little more than half of its shares sold short. That reading is only half of a percentage point higher versus mid-June but has nearly doubled since the start of the year. Although it continues to sit near the top of the list, Redbox Entertainment (RDBX), has perhaps seen the most notable shift in levels of short interest versus the last bi-weekly report. Throughout the year, the recent SPAC has seen large swings in its reported short interest levels. Click here to learn more about Bespoke’s premium stock market research service.

Jul 13, 2022
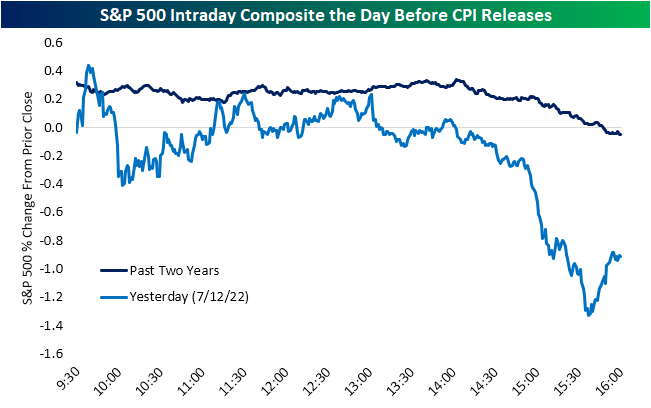
For most of the session yesterday, the S&P 500 was having trouble choosing a direction, but come the final hours of trading with a CPI release looming, the index took a decisive turn lower. Given rampant hot inflation over the past couple of years and its implications for changes to monetary policy, that sort of late day selling ahead of CPI prints has been the norm as shown below. On average for the past two years, the day before CPI releases has typically seen the S&P 500 trade higher for most of the session before turning lower and erasing its gains in the afternoon; just as we saw yesterday.
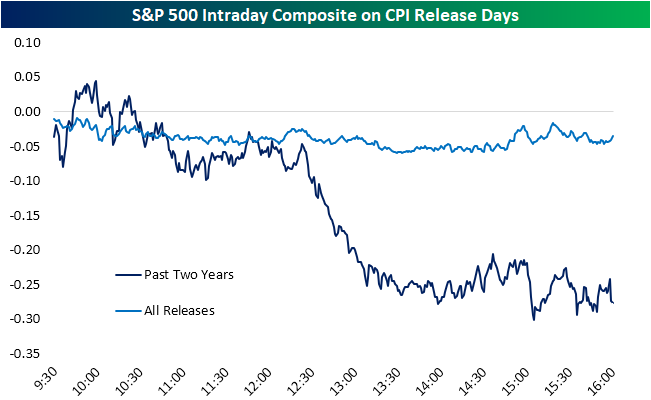
With another hotter than expected print this morning for both headline and core measures of inflation, yesterday’s late day sellers seem to have been on the right side of the trade as the S&P 500 has fallen further and is on pace for the sixth drop on a CPI print in a row. Taking a look at intraday price action of the S&P 500 on CPI release days, historically there has been a downward bias with all releases since 2000 averaging a drop of a few basis points by the close. Over the past two years it has been far worse with an average decline of 28 bps. Most of that drop has actually occurred after a bout of midday selling.
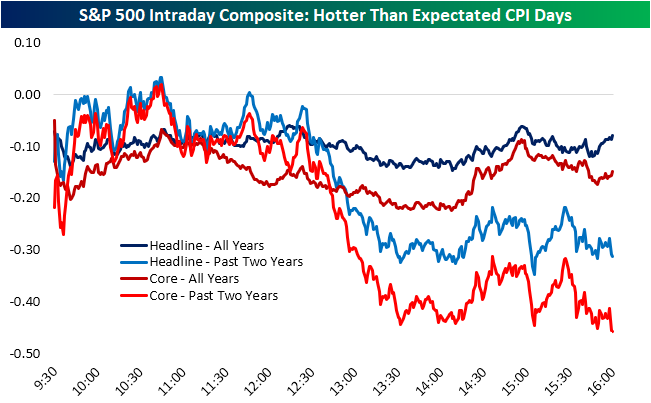
Using data from our Economic Indicator Database, filtering out for only times in which CPI has come in above expectations (on a month over month basis), that same pattern is apparent. The S&P 500 tends to trade in the red for most of the morning but the worst declines occur in the early afternoon before some stabilizing into the close.
In response to today’s hotter than anticipated release, the S&P 500 gapped down 1.2% which ranks as the fourth worst gap down for the index on a CPI day since at least 2000. Going back over the past two decades, there have only been a total of seven gaps down of 1% or more on a CPI day. Including today, four of those releases have occurred this year: February (-1.2%), March (-1%), June (-1.64%), and today (-1.23%). Taking a look at the intraday pattern of the S&P 500 across those 1% or larger gaps, the index has tended to continue to fall throughout the session with the lows of the day tending to occur around 2:30 EST with modest sideways action into the close from there. Click here to learn more about Bespoke’s premium stock market research service.
