Jul 19, 2022
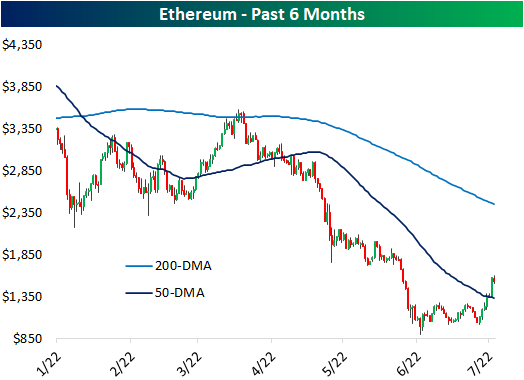
Risk assets have found some stability in the past month, but one asset that has been absolutely flying higher in Ethereum. The past week’s rally has risen to a remarkable 51% for the world’s second largest crypto bringing its market cap up from $126 billion to $187 billion. In that same span, Bitcoin has only gained 15.5%. After those moves, Bitcoin has returned to its 50-DMA while Ethereum has surged through the line.

Given that massive outperformance of Ethereum, the ratio of Bitcoin to Ethereum has collapsed. In fact, the ratio has now fallen for seven days in a row, tying three other streaks (September 2019, February 2020, and April of this year) for the longest streaks of consecutive days of declines.

The ratio has fallen considerably as well as consistently in the past week. Exactly one week ago, the ratio hit a near term high and has dropped 23.5% since then. As shown above, that brings the ratio down to the rough uptrend line that has been in place since late last year. Since the start of our price data for Ethereum in November 2017, there have only been a handful of other periods in which this ratio has fallen as sharply; meaning times when there has been similar underperformance of Bitcoin relative to Ethereum. The most recent of these was a little over a year ago in May 2021.

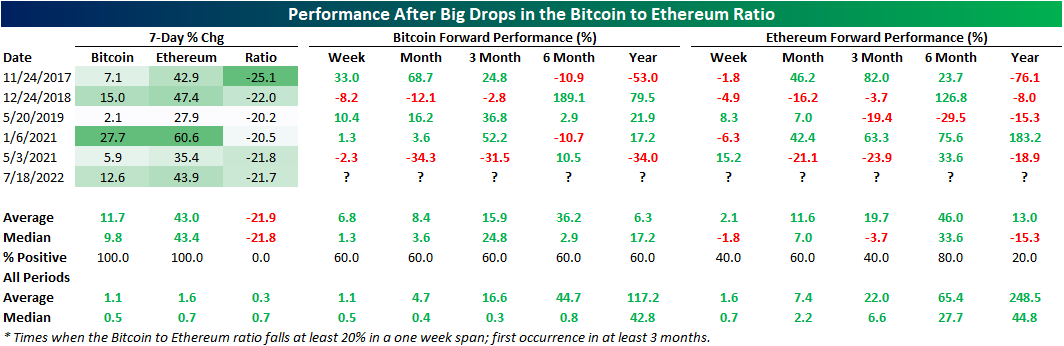
Below we show the performance of Bitcoin and Ethereum during each one of those one week declines of at least 20% in the ratio without another occurrence in the prior three months. This most recent drop in the ratio is only the sixth time such a move has occurred. Performance this time around has been middling relative to these other instances with Ethereum’s 43.9% rally through yesterday when the ratio crossed the 20% decline threshold roughly inline with the median performance of other instances (43.4%). Bitcoin on the other hand has actually been doing a little better with its 12.6% rally larger than the median of 9.8%.
As for where the two largest cryptos head from here, historical performance has been mixed. Overall Bitcoin has more consistently moved higher across the following year. One year out has perhaps been the period with the most dramatic outperformance of Bitcoin. Although it was only higher 60% of the time, Ethereum was only higher one year later once following the January 2021 instance. Click here to learn about Bespoke’s Weekly Crypto Report.
Jul 18, 2022
Log-in here if you’re a member with access to the Closer.
Looking for deeper insight into markets? In tonight’s Closer sent to Bespoke Institutional clients, we begin by providing some insight into the macro implications of corporate decisions and comments from the likes of Apple (AAPL), Bank of America (BAC), and IBM (IBM) earnings (page 1). We then provide a look at major Wall Street firms’ performance of trading and investment banking businesses (page 2). We follow up by showing the impacts of mortgage rates on the housing market (page 3) before finishing with a preview of this week’s Treasury issuance (page 4) and the huge net short positioning in S&P 500 futures (pages 5 – 7).
See today’s full post-market Closer and everything else Bespoke publishes by starting a 14-day trial to Bespoke Institutional today!
Jul 18, 2022
Another bad reading for housing hit the tape today as the NAHB’s Housing Market Index measuring the confidence of US homebuilders experienced its second largest decline on record behind the drop in April 2020. Homebuilder sentiment cratered 12 points month over month sending the index to the lowest level since May 2020 which is also one point below the late 2018 low.
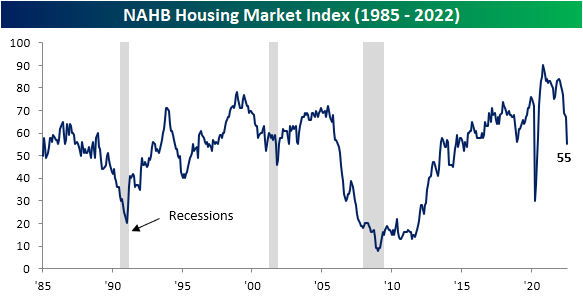
Given the drop in the headline number, each of the individual components (present and future sales and sales traffic) similarly experienced historic declines month over month. Like the headline index, Present Sales and Traffic only experienced larger declines at the start of the pandemic. The same goes for Future Sales, although there was also a slightly larger drop in December 1987 making this month’s drop the third largest on record.

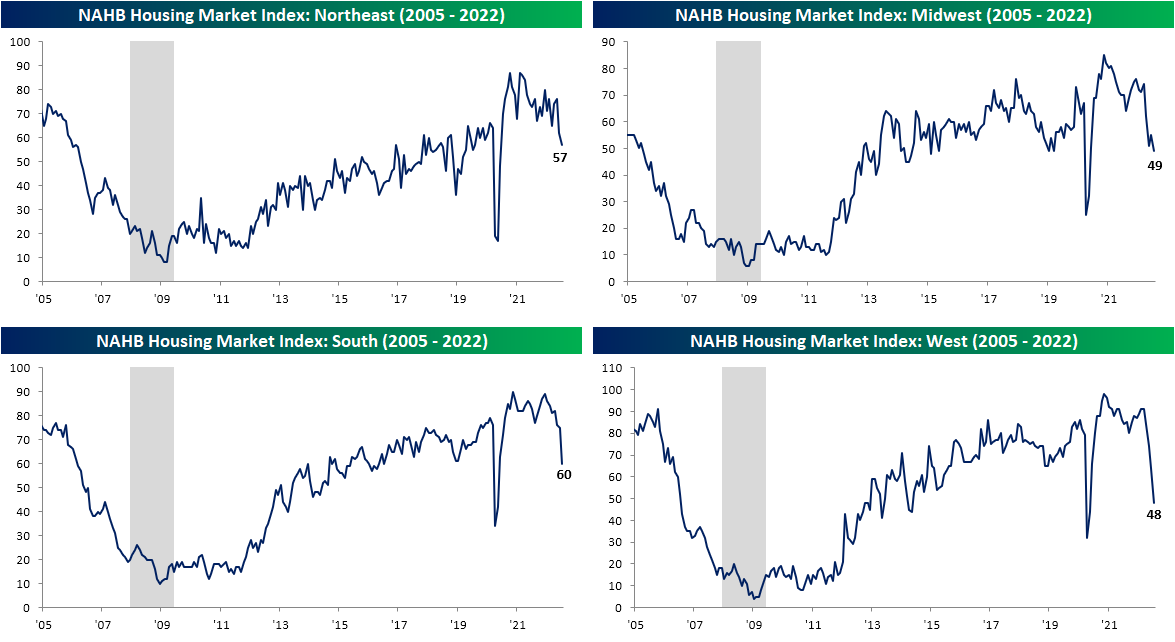
Geographically, no area of the country has been safe from plummeting sentiment, but the Northeast has held up remarkably well. Whereas the South and West saw double digit monthly declines that both were the second largest on record, the Northeast only fell five points to 57. That is a reading just shy of the top quartile of readings unlike the other regions that are in the 52rd percentile at best (South).
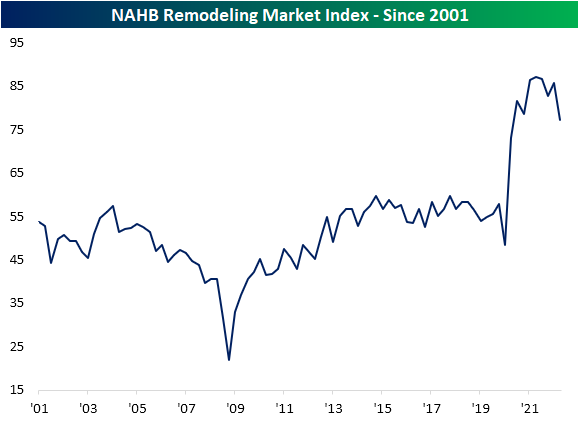
The lower sentiment for homebuilders is of course a function of rising mortgage rates and the subsequent dampening demand as a result. As for builder’s roles in existing homes, sentiment is also rolling over. In addition to today’s release, last week saw the quarterly release of the NAHB’s Remodeling Market Index measuring builder’s sentiment regarding remodeling projects. Unlike the Housing Market Index, this index remains historically elevated and down just a bit. In other words, remodeling demand has taken a hit but not to the same extent as projects to build a new home.
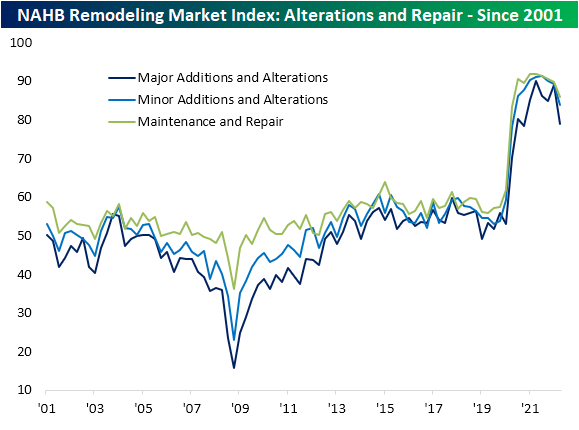
The most pronounced decline in remodeler sentiment has come from the projects carrying the highest costs ($50K or more) even though smaller project outlooks have also been falling for a few quarters now.
Backlogs have been unwinding as well even if they are historically elevated. A likely big reason for that has been a deceleration in new projects. The index for Appointments for Proposals is much less elevated in the 48th percentile compared to 56th for the headline reading or 68th for Backlog of Remodeling Jobs.

Jul 18, 2022
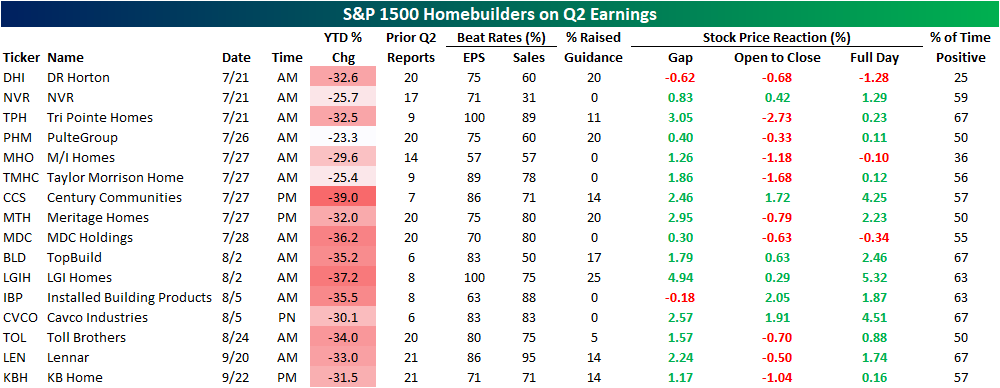
While homebuilder sentiment experienced a historic plunge in the latest reading, homebuilder stocks have actually been on the move higher in today’s session. That brings the total rally off of the June low above 20%, although that is only a dent in the larger decline since late last year. The S&P 1500 Homebuilders group is currently down 31.4% since the December 10th high. Without a coincident drop alongside sentiment, homebuilders continue to hold above their 50-DMA.

Homebuilders are at a bit of a crossroads at the moment as a further move higher would definitively break the past several months downtrend whereas a break back below its 50-DMA would mark a failed breakout similar to what happened earlier this spring. If today is any indication, macro data hasn’t been a particularly strong catalyst for the industry, however, there is a huge slate of earnings in the month ahead. Later this week on Thursday, DR Horton (DHI), NVR (NVR), and Tri Pointe Homes (TPH) are all scheduled to release quarterly results. Of these, DHI has actually averaged some of the worst performance on Q2 earnings of any homebuilder. The stock has averaged a 1.28% decline on its historical Q2 earnings reaction days and positive returns only a quarter of the time. As for other notables, Q2 has tended to be the best quarter of the year for stock price performance of Century Communities (CCS), Installed Building Products (IBP), LGI Homes (LGIH), and NVR (NVR). Click here to learn more about Bespoke’s premium stock market research service.