Jul 29, 2022
The S&P 500 has gained more than 1% on each of the last four Fed Days going back to March. The March meeting was the first rate hike of the Fed’s current tightening cycle, and every meeting since then has seen a hike of at least 50 basis points. Each time, the S&P surged on the day of the hike.
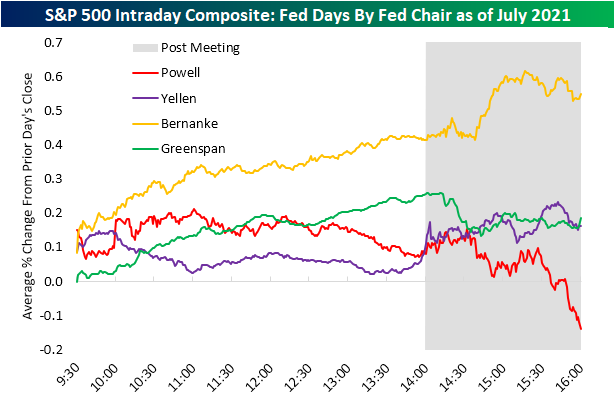
The recent equity market strength on Fed Days is a new trend. Market performance on Fed Days during Powell’s first few years at the helm was notoriously weak. Below we show the S&P 500’s average intraday performance on Fed Days by Fed chair since 1994 when policy changes first started being announced on the same day as the meeting. For Chair Powell, we show the S&P’s average performance on Fed Days during his tenure only through July 2021. At the time a year ago, Powell Fed Days were by far the worst of any Fed chair, and the market typically plunged into the close after the 2 PM ET announcement.
What a difference a year makes. Below we show the S&P’s average intraday performance on Fed Days by Fed chair updated through the most recent FOMC meeting this week. Whereas Powell Fed Days were by far the worst for the market at this time last year, they’re now the second best behind only Bernanke Fed Days.

To highlight the improvement in the market response to Fed Chair Powell another way, below we show the full-day percentage change of the S&P 500 on Fed Days during Powell’s tenure as well as how the cumulative averages have evolved for both the full-day change and performance from 2:30 PM ET through the close (encapsulating the market response to the presser, or the chair more directly).
As you can see, the S&P was extremely weak on Powell Fed Days early on during his tenure, but over the last year, the market has reacted extremely positively. Seven of the last eight Powell Fed Days have seen positive moves for the S&P, with the last four all seeing gains of more than 1%. Click here to learn more about Bespoke’s premium stock market research service.

Jul 28, 2022
Log-in here if you’re a member with access to the Closer.
Looking for deeper insight into markets? In tonight’s Closer sent to Bespoke Institutional clients, we start out with recaps of the much awaited mega-cap earnings of Amazon (AMZN) and Apple (AAPL) (page 1). We then provide some commentary as to how to define a recession (page 2) before reviewing today’s GDP data (page 3) and some additional observations from the national income and product accounts (page 4). We then evaluate Fed Chair Powell’s statements yesterday regarding the upswing in claims being seasonal (page 5). We finish with an overview of today’s solid 7 year note auction (page 6).
See today’s full post-market Closer and everything else Bespoke publishes by starting a 14-day trial to Bespoke Institutional today!
Jul 28, 2022
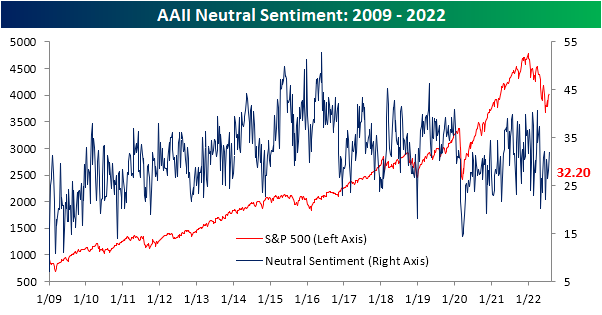
Bullish sentiment measured by the weekly AAII survey has been a series of back and forth moves over the past several weeks. After reaching the highest level in over a month last week, bullish sentiment fell back down to 27.7%. Even with that decline, bullish sentiment has now managed to hold above 25% for at least three weeks in a row for the first time since the start of the year. We also must note, that the AAII survey collects data from Thursday at 12:01 AM through Wednesday 11:59 PM meaning any boost to sentiment from yesterday’s FOMC post-meeting rally will not necessarily be fully captured in this report.

Whereas bullish sentiment has had its fair share of back and forth moves, bearish sentiment has more consistently fallen with this week being the third sequential decline in a row. Now at 40%, bearish sentiment is at the lowest level since the first week of June.

Given the drop in bulls was slightly smaller than that of bears this week, the bull-bear spread continued to move in a less negative direction. However, in spite of any improvement, this week was the 17th negative reading in a row as that streak remains the third longest on record.
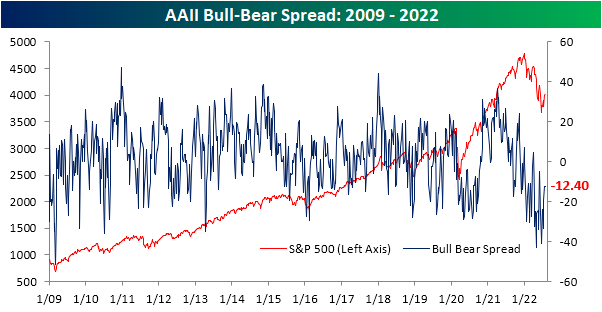

Not only have bears outnumbered bulls for 17 straight weeks, but there has actually only been one week this year (the final week of March) in which that was not the case. As a result, this year is on pace to have averaged the lowest levels of bullish sentiment and the highest levels of bearish sentiment of any year in the survey’s history.

With both bulls and bears lower in the most recent survey, neutral sentiment picked up the difference rising to 32.2%. That is the most elevated reading since April and back into the middle of the post-pandemic range. Click here to learn more about Bespoke’s premium stock market research service.
Jul 28, 2022
Initial jobless claims continue to disappoint. Although this week’s release technically fell down to 256K, it was from a 10K upwardly revised number of 261K last week. Both this week and last’s readings are the highest since the fall and would also mark the highest readings since the fall of 2017 outside of the historically elevated readings of the pandemic.

The pandemic was a volatile time period for jobless claims data as readings rose into the millions. As such, revisions over the past couple of years have gotten historically large in turn, albeit less so over the past year. Although it may not sound like much, last week’s 10K revision was actually sizable. It was the largest revision since the week of July 4th last year, and prior to the pandemic, the week before Christmas in 2012 was the last time there was a double-digit revision.
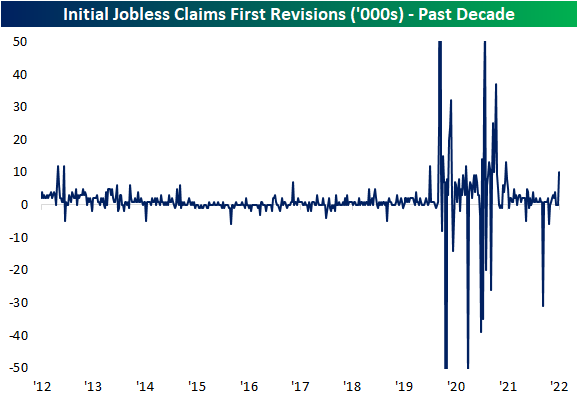
In his post meeting presser, Fed Chair Powell mentioned how the rise in initial jobless claims may be seasonal in nature. While we will provide some more in depth analysis to these comments in regards to the data in tonight’s Closer, as we have noted in the past, jobless claims have been roughly following standard historical seasonal patterns this year. July typically sees a temporary seasonal spike higher, but as we noted last week, that seasonal peak appears to have been put in place a bit later than usual which is rare but not exactly an unprecedented occurrence. While claims will likely get some seasonal tailwinds in the coming weeks (including this week of the year as claims have fallen around 90% of the time historically), the actual level of claims for the current week of the year is now well above comparable weeks for the few years prior to the pandemic. In other words, before or after seasonal adjustment, claims have come off their strongest levels and revisions have not exactly made things any better.

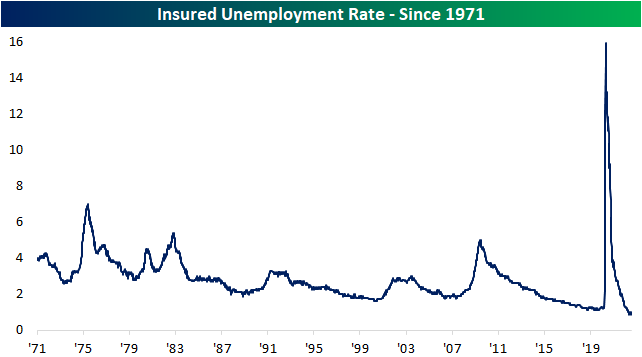
As for continuing claims, the latest week saw a 25K decline to 1.359 million. While that does mark some deterioration from the strongest levels, unlike initial claims, continuing claims are still well below levels from prior to the pandemic indicating a still very healthy labor market the likes of which has not been seen in decades as the insured unemployment rate (continuing claims as a percentage of the number of those covered by state insurance programs) continues to hover near 1%. Click here to learn more about Bespoke’s premium stock market research service.