Nov 23, 2022
Due to tomorrow’s holiday, this week’s jobless claims data was released a day early and were not exactly a release to be thankful for. The latest readings were bad all around with both initial and continuing claims rising more than expected. For initial claims, last week’s level was revised up by 1K to 222K, and this week’s reading rose by 18K to 240K. That is the highest level of claims since the week of August 18th, and the sequential increase was the largest since the end of September. Whereas recent readings on jobless claims have been healthy in the sense that they have remained within the range of low readings from the few years prior to the pandemic, this new high would have been at the high end of the 2008 to 2019 pre-pandemic range.

On a non-seasonally adjusted basis, the current week of the year typically sees claims move higher with a week-over-week increase 82% of the time. However, this week’s increase was around 10K larger than what the comparable week of the year has historically averaged. In other words, from a seasonal perspective, the rise in claims is perfectly normal in terms of direction but less so in terms of size. Now at 248K, claims are in line with levels for the comparable weeks in 2021 and 2019.

Continuing claims continue to be the more interesting story around jobless claims. Delayed one week to the initial claims number, continuing claims as of the week of November 11th rose for a sixth week in a row. As we noted last week, such a streak of consistent increases in continuing claims has been rare, especially in the years following the Global Financial Crisis. In fact, the rise during the onset of the pandemic in 2020—which lasted for 10 consecutive weeks—was the only other notably lengthy streak post-2009. Prior to that, there have only been a handful of other times in which continuing claims have risen for 10 weeks or more.

As for the current rise in claims, the latest increase leaves the reading at 1.551 million which is the highest level since the first week of March. From a historical perspective, though, that remains an impressively low reading and well below the pre-pandemic range even if it is rapidly deteriorating.

As for just how bad of a stretch it has been for continuing claims, the 187K increase, or 13.7% jump, during the past six weeks would be by far the largest in over a decade outside of the start of the pandemic. Additionally, such a large increase in the span of six weeks is consistent with increases from all prior recessions. In fact, as claims have made their way off of historic lows, the current increase is nearly the same size as the early 1990s recession and is even larger than those in the early 1980s and early 2000s. Click here to learn more about Bespoke’s premium stock market research service.

Nov 22, 2022
Log-in here if you’re a member with access to the Closer.
Looking for deeper insight into markets? In tonight’s Closer sent to Bespoke Institutional clients, we start out tonight with a look at equities’ new highs and whether or not high yield confirmed the move (page 1). We then take a look at volumes for this point of the year for Treasuries (page 2) followed by a 7 year note auction recap (page 3) and a look at the latest allotment data (pages 4 and 5). Next, we review the latest non-manufacturing data from the Philly Fed’s (page 6 and 7) before pivoting to an update of our Five Fed Manufacturing Composite (page 8). We close out with the EIA’s monthly update of energy production and consumption.

See today’s full post-market Closer and everything else Bespoke publishes by starting a 14-day trial to Bespoke Institutional today!
Nov 22, 2022
As we do each Monday, in last night’s Closer we recapped the latest Commitments of Traders data from the CFTC. This data set provides a look at how speculators have positioned themselves (long or short) in various futures. We show those readings as a net percentage of open interest. In other words, higher positive values indicate a much larger share of open interest is positioned long and vice versa for negative readings.
In the commodities space, after longs backed out in a big way earlier this year, readings have risen rapidly in gold, silver, copper, and palladium futures. As for how sharp of turnarounds they have been, the increase over the past two weeks rank in the top decile of all periods in data going back to the mid 1980s for each of the previously mentioned metals.
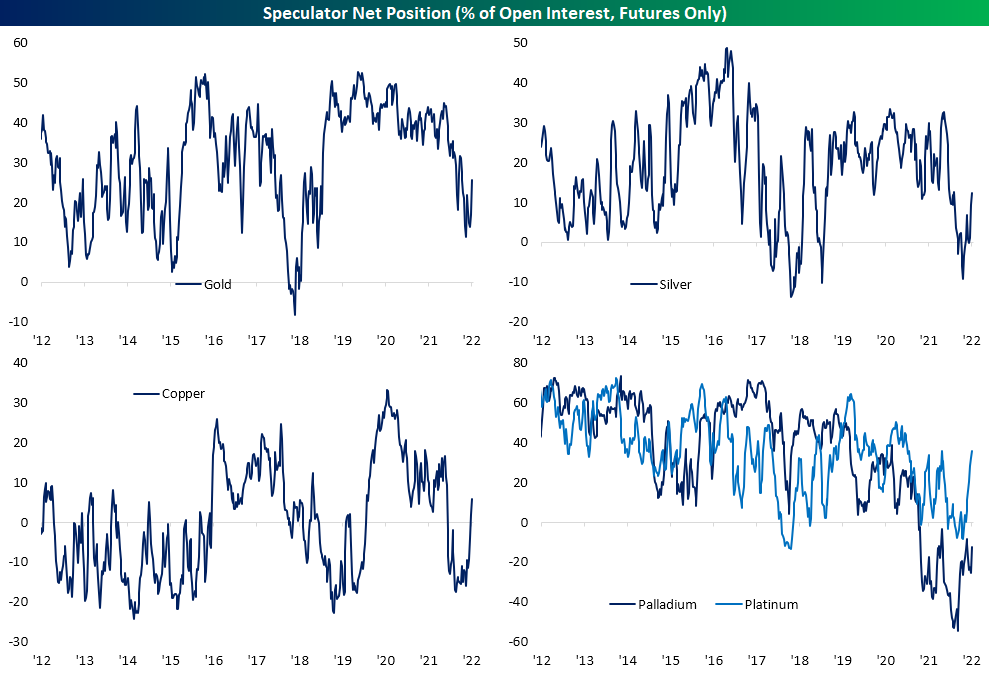
For the most widely followed of these metals (gold, silver, and copper), this is only the 14th time on record each of their two week changes ranked in the 90th percentile or above in the same week without another occurrence in the prior three months. The most recent occurrence of such a large broad increase in major metals positioning was in July of 2014.
Although these readings indicate that speculators are increasingly placing long bets on these futures, such data actually can be a bit of a messy indicator for forward performance. Although these readings indicate bullish sentiment, forward performance is the opposite in the near term with dramatic underperformance relative to the norm one week later (which we have seen play out so far). One month and three month performance tends to see further declines in these commodities as well which is not exactly unheard of for precious metals while it is dramatically weaker for the industrial metals. Six month performance is generally more in line with historical norms while the bullishness in positioning only seems to come through to price action one year out. One year average returns for gold, silver, and copper are much stronger than the norm, although positivity rates are still just barely above 50/50. (Past performance is no guarantee of future results.) Click here to learn more about Bespoke’s premium stock market research service.
