Dec 1, 2022
Initial jobless claims dipped this week erasing most of the prior week’s increase. Last week’s level was revised up by 1K to 241K and fell down to 225K in the most recent data. That is 10K below forecasts and continues what has been a fairly choppy trend in the indicator. Initial claims are going on roughly two months of switching back and forth between weekly increases and decreases with the most recent print in the middle of the past six-month range. In other words, there has not been much in the way of a consistent or clear pattern in jobless claims.

On a non-seasonally adjusted (NSA) basis, last week saw the usual dip in claims for Thanksgiving week. For this week of the year, claims have historically only risen 29% of the time. While the direction of the move was consistent with history, the 50.5K decline in the unadjusted number was fairly significant, coming in around 12K more than the historical median for the comparable week of the year. Due to that larger-than-normal drop, claims remain at impressive levels with only 1968 having seen a lower reading for the comparable week of the year.

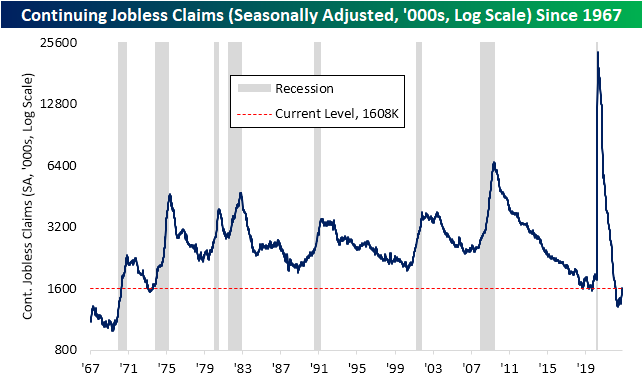
Recent readings on continuing claims continue to starkly contrast with those solid readings in initial claims. Whereas initial claims have returned to levels consistent with the few years prior to the pandemic for some time now, continuing claims have been well below their own pre-pandemic range. That is until this week. Claims have continued to rise, and as of the week of November 19th (continuing claims are lagged an additional week to the initial claims number), continuing claims rose back above 1.6 million for the first time since the end of February. That is also back into the low end of the pre-pandemic range.
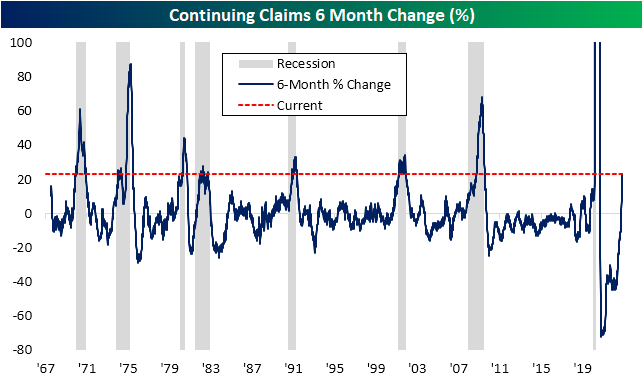
We would also note that this week’s data marks six months out from the May 21st low of 1.306 million. With claims having risen over 300K (or 23.12%) since then with a particularly sharp increase in the most recent print, that six-month rate of change appears to be a warning sign for recession. As shown below, there is plenty of precedent for claims to have risen by as large, if not larger, of a degree in half a year, but every one of those periods has occurred in the midst of a recession. All that is to say that claims continue to sit at healthy levels for the moment but the picture is changing- for the worse. Click here to learn more about Bespoke’s premium stock market research service.
Nov 30, 2022
Log-in here if you’re a member with access to the Closer.
Looking for deeper insight into markets? In tonight’s Closer sent to Bespoke Institutional clients, we start out tonight with an update of a quantified look at the Beige Book as well a recap and analysis of Fed Chair Powell’s commentary this afternoon (pages 1 and 2). We then rundown the latest update of GDP (page 3), trade balance and inventories (page 4), and JOLTS (page 5). We follow up with a look at the S&P 500 finally breaking its streak below its 200-DMA (page 6) and show a decile breakdown of equity performance today (page 7). We finish with a review of the impressive print on oil inventories from the EIA (page 8).

See today’s full post-market Closer and everything else Bespoke publishes by starting a 14-day trial to Bespoke Institutional today!
Nov 30, 2022
Prospective home buyers have finally gotten some relief at least in terms of mortgage rates. The national average for a 30-year fixed rate mortgage via Bankrate.com’s data is down to 6.78% from a high of 7.35% on November 3rd. While that remains at levels we haven’t seen since the early 2000s, the roughly half of one percentage point decline in the past three weeks is also remarkable. As shown in the second chart below, on Monday, the national average had fallen 0.53 percentage points in a three-week span. The only other time in which there was as large of a drop in that period of time was in September 2008.

Given rates for 30-year mortgages are at the highest level in a couple of decades, there has been little incentive for most homeowners to refinance resulting in refinance applications continuing to evaporate. Applications fell 12.87% week over week bringing the index down to the lowest level since June 2000.

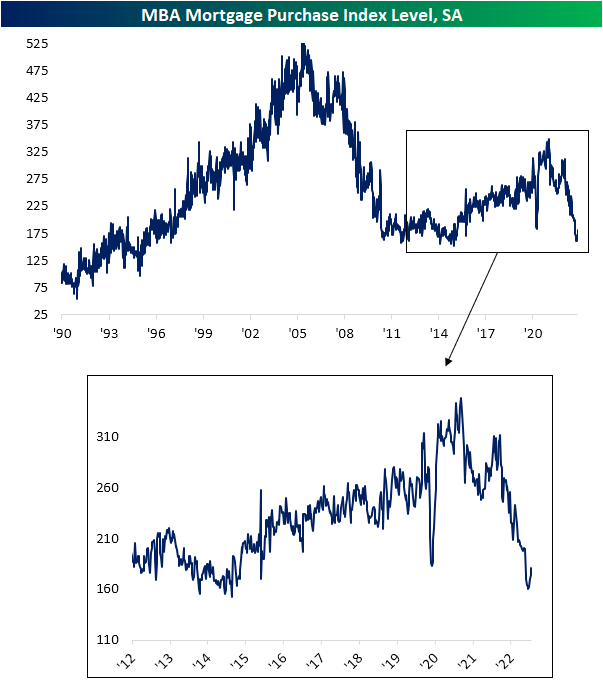
Purchases applications have been more largely impacted by the recent reversal in rates. The Mortgage Bankers Association’s purchase index has now risen four weeks in a row (the longest streak of consecutive increases since last November). The 12.77% jump in purchase applications in that time has been the largest four-week jump since a 14.61% increase in November of last year. Of course, that only puts a minor dent in the absolute collapse in mortgage activity over the past year.
Showing purchase applications on a non-seasonally adjusted basis better illustrates housing’s fall from grace this year. Whereas applications started the year around some of the highest levels of the past decade for that time of year, this week they have hit the lowest level for the comparable week of the year of the past decade. That’s what happens when the FOMC embarks on one of the most aggressive tightening cycles in history! Of course, the Thanksgiving holiday tends to negatively impact implications, and looking at 2014 (when the Thanksgiving drop occurred a week later than this year) applications were slightly lower than this year.
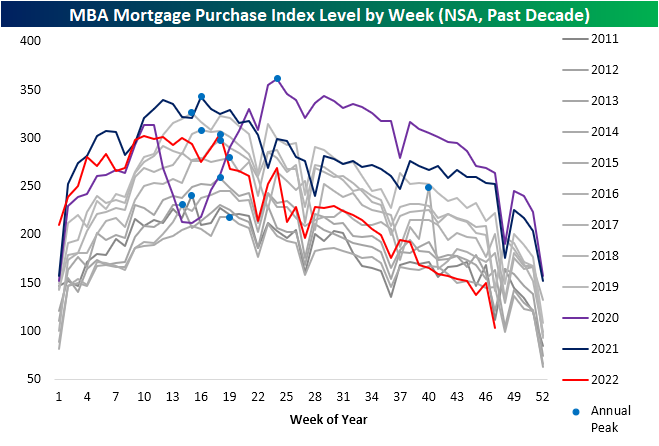
Shown another way, below we show the percent change in applications from each year’s respective annual peak out through 29 weeks later. This year has seen applications fall 66%. That was a similar decline to 2001, and the only year with a larger decline was in 2007. Click here to learn more about Bespoke’s premium stock market research service.

Nov 29, 2022
Log-in here if you’re a member with access to the Closer.
Looking for deeper insight into markets? In tonight’s Closer sent to Bespoke Institutional clients, in tonight’s note, we begin with some commentary on recent 2 year yield, dollar, credit, and VIX action (page 1) followed by an update on the latest home price data (page 2). We finish with some commentary on the latest sentiment data from a range of indicators including our latest Consumer Pulse Survey (pages 3 and 4).

See today’s full post-market Closer and everything else Bespoke publishes by starting a 14-day trial to Bespoke Institutional today!