Dec 2, 2022
Bespoke’s Crypto Report contains numerous technical, momentum, and sentiment charts for bitcoin, ethereum, and other key cryptos. Page 1 of the report includes our weekly commentary on the space and attempts to identify any new trends that are emerging. The remaining pages include important overbought/oversold levels to watch, charts on historical drawdowns and rallies, seasonality trends, futures positioning data, Google search trend shifts, and more. Our weekly Crypto Report is produced so that followers of the space can more easily stay on top of price action, technicals, seasonality, and sentiment.
Sign up for a monthly or annual subscription to Bespoke Crypto to receive our weekly Crypto Report and anything else we publish related to cryptos. Note: If you’re currently a Bespoke Premium, Bespoke Newsletter, or Bespoke Institutional subscriber, you’ll need to subscribe to Bespoke Crypto as an add-on to receive access. The weekly Crypto Report and any additional crypto analysis is not included with our Premium, Newsletter, or Institutional memberships. You can sign up for Bespoke Crypto and receive our Crypto Report in your inbox weekly using the monthly or annual checkout links below. If you sign up for the annual plan, the first year of access is 50% off!
Bespoke Crypto Access — Monthly Payment Plan ($49/mth)
Bespoke Crypto Access — Annual Payment Plan ($247.50 for the first 12 months, then $495/year in year 2 and beyond)

Bespoke Investment Group, LLC believes all information contained in this service to be accurate, but we do not guarantee its accuracy. None of the information in this service or any opinions expressed constitutes a solicitation of the purchase or sale of any securities, commodities, or cryptocurrencies. This service contains no buy or sell recommendations. This is not personalized advice. Investors should do their own research and/or work with an investment professional when making portfolio decisions. As always, past performance of any investment is not a guarantee of future results. Bespoke representatives or clients may have positions in securities discussed or mentioned in its published content.
Dec 1, 2022
Log-in here if you’re a member with access to the Closer.
Looking for deeper insight into markets? In tonight’s Closer sent to Bespoke Institutional clients, we begin tonight with a look at the dollar breaking its streak above its 200-DMA (page 1) followed by a review of layoff announcements (page 2). Next, we provide a rundown of the latest personal income and spending data (page 3) as well as the ISM and S&P Global readings on the manufacturing sector (page 4). We finish with a dive into housing inventories (pages 5 and 6).

See today’s full post-market Closer and everything else Bespoke publishes by starting a 14-day trial to Bespoke Institutional today!
Dec 1, 2022
For most major global equity markets, at some point this Fall a 52-week low has been put in place, with significant rallies since then. As shown below, of the 22 ETFs tracking key country stock markets in our Global Macro Dashboard, the average gain off the low is now 22%. The largest of these rallies have come from Germany (EWG), Italy (EWI), and China (MCHI), which have all risen over 30%. For China, that gain has come in the shortest span of time with October 31st being its low, whereas Italy and Germany’s lows were a few weeks further back. One other interesting note regarding China is currently it trades only slightly above its 50-DMA whereas a majority of other country ETFs are in or at least near overbought territory. On the other end of the spectrum, the US (SPY) has experienced the most modest rally having only risen 13.82%. India (INDA) is close behind with a 13.89% gain, although it bottomed before the rest of the world with its 52-week low being back on June 17th.

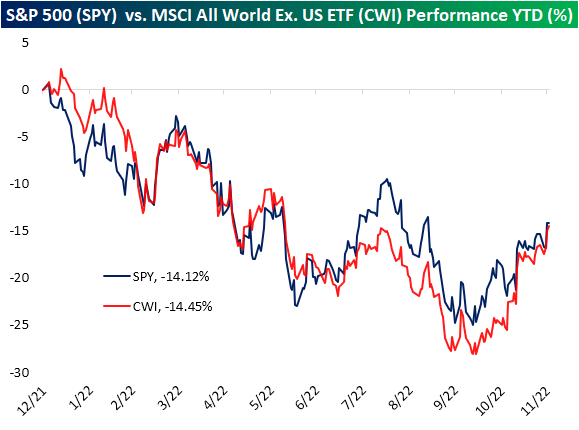
While much of the rest of the world has experienced a larger rebound off the lows, year to date performance between the US (SPY) and global equities excluding the US—proxied by the MSCI All World ex. US ETF (CWI)—is now very similar. The US is marginally in the lead with a -14.12% YTD total return versus a 14.45% drop for CWI. At the lows at the end of Q3, international markets were underperforming the US by more than 5 percentage points, but that gap has been closed during the current rally. Click here to learn more about Bespoke’s premium stock market research service. As always, past performance is no guarantee of future results.
Dec 1, 2022
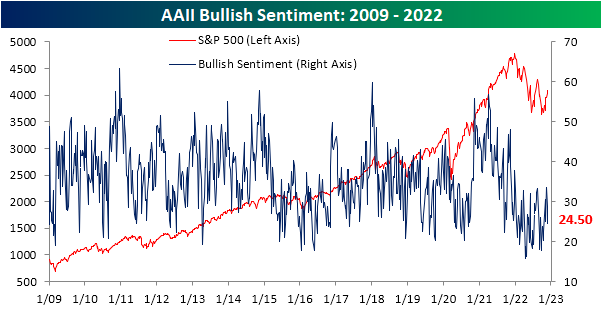
Although the S&P 500 has had some positive technical developments like taking out the 200-DMA on the backs of a lack of hawkish Fedspeak, sentiment has been headed lower over the past couple of weeks. Per the latest survey data from AAII, only 24.5% of investors reported as bullish this week; down from 28.9% last week and a recent high of 33.5% the week before that. That nine percentage point decline in the past couple of weeks is not a particularly large drop and only brings the reading into the middle of this year’s range, however, it marks a distinct turnaround from what had been one of the most optimistic readings of the year only two weeks ago.
As bullish sentiment has been on the move, bearish sentiment has gone into hibernation and done a whole lot of nothing. After being unchanged at 40.2% last week, bearish sentiment rose modestly to 40.4%.

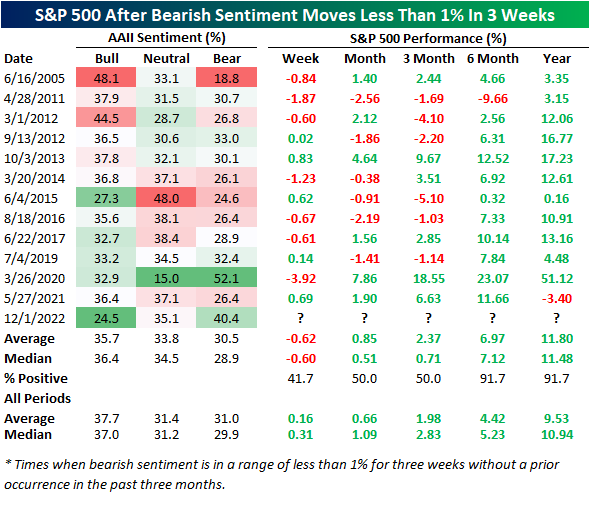
In the history of the survey, that is the tightest three-week range on record and there have only been another dozen times in which bearish sentiment readings were even within a 1% range over a three-week span. The most recent of those was last May, and there was another right around the time of the COVID Crash lows. We would note that with bears little changed around 40%, the current instance marks the second highest bearish sentiment reading of these instances behind that March 2020 occurrence.
In terms of what it means for the S&P 500 when bearish sentiment moves so little as it has recently, near-term performance does not tend to be particularly favorable. One week out has averaged a 0.6% decline and one and three-month returns have been positive only half the time. As for longer-term performance though, the S&P 500 has tended to trade higher six months to one year out very consistently with gains over 90% of the time. Those gains are also slightly larger than the norm for all periods.
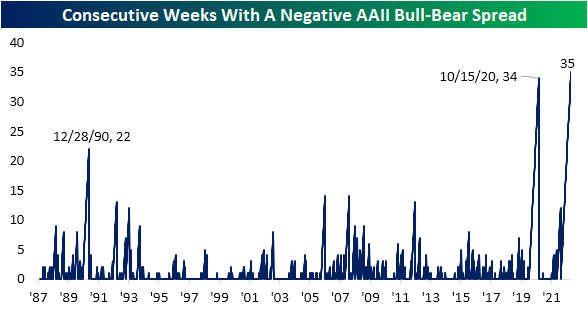
With sentiment taking negative tones, the bull-bear spread has reversed lower after some of the highest readings of the year last month. Given the spread remains negative, the streak of below-zero readings has grown to a record 35 weeks in a row, surpassing the 2020 streak.

Given bears have not picked up the losses to bulls, nearly all of the difference has gone to neutral sentiment. Neutral sentiment has risen to 35.1% which is 1.4 percentage points below the high from the first week of November. Click here to learn more about Bespoke’s premium stock market research service.
