Jan 13, 2023
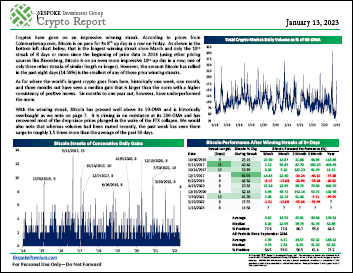
Bespoke’s Crypto Report contains numerous technical, momentum, and sentiment charts for bitcoin, ethereum, and other key cryptos. Page 1 of the report includes our weekly commentary on the space and attempts to identify any new trends that are emerging. The remaining pages include important overbought/oversold levels to watch, charts on historical drawdowns and rallies, seasonality trends, futures positioning data, Google search trend shifts, and more. Our weekly Crypto Report is produced so that followers of the space can more easily stay on top of price action, technicals, seasonality, and sentiment.
Sign up for a monthly or annual subscription to Bespoke Crypto to receive our weekly Crypto Report and anything else we publish related to cryptos. Note: If you’re currently a Bespoke Premium, Bespoke Newsletter, or Bespoke Institutional subscriber, you’ll need to subscribe to Bespoke Crypto as an add-on to receive access. The weekly Crypto Report and any additional crypto analysis is not included with our Premium, Newsletter, or Institutional memberships. You can sign up for Bespoke Crypto and receive our Crypto Report in your inbox weekly using the monthly or annual checkout links below. If you sign up for the annual plan, the first year of access is 50% off!
Bespoke Crypto Access — Monthly Payment Plan ($49/mth)
Bespoke Crypto Access — Annual Payment Plan ($247.50 for the first 12 months, then $495/year in year 2 and beyond)
Bespoke Investment Group, LLC believes all information contained in this service to be accurate, but we do not guarantee its accuracy. None of the information in this service or any opinions expressed constitutes a solicitation of the purchase or sale of any securities, commodities, or cryptocurrencies. This service contains no buy or sell recommendations. This is not personalized advice. Investors should do their own research and/or work with an investment professional when making portfolio decisions. As always, past performance of any investment is not a guarantee of future results. Bespoke representatives or clients may have positions in securities discussed or mentioned in its published content.
Jan 12, 2023
Log-in here if you’re a member with access to the Closer.
Looking for deeper insight into markets? In tonight’s Closer sent to Bespoke Institutional clients, we start out with a look at the two year yield’s breakdown as the S&P 500 runs into resistance (page 1). Next, we dive into the latest CPI data including what drove today’s print and the potential paths it can take from here (pages 2 – 4). We follow up with a look at transportation costs from Cass (page 5) then run through the details of today’s historically strong 30 year bond reopening (page 6). We finish by taking a look at the plateau in housing inventories (page 7) as housing sentiment is a shade of its former self (page 8)

See today’s full post-market Closer and everything else Bespoke publishes by starting a 14-day trial to Bespoke Institutional today!
Jan 12, 2023
The S&P 500 has rallied impressively in the past week leading up to Thursday’s CPI print, and bullish sentiment has lifted along with it. While the reading remains low, the percentage of respondents to the weekly AAII sentiment survey reporting as bullish rose from 20.5% up to 24%. Bulls were higher only two weeks ago when the reading was at 26.5%

That rise in bulls has meant bearish sentiment has fallen to a notable level. For the first time since the first week of November and for only the eleventh time in the past year, bearish sentiment came in below 40%. Bearish sentiment has now fallen for three weeks in a row, which is the longest streak of consecutive declines since last August as well.

Although bullish and bearish sentiment are sending a more optimistic tone, the bull-bear spread remains heavily in favor of bears at -15.9. That grows the record streak of negative readings to 41 weeks in a row.


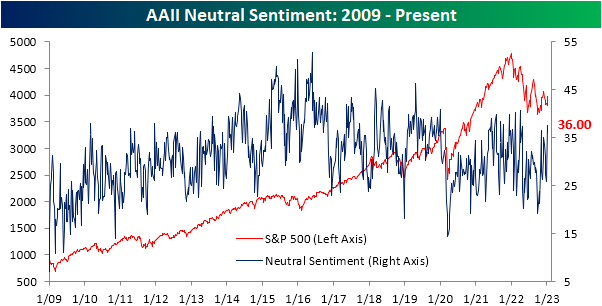
Last week, neutral sentiment leaped higher given the mid-single-digit declines in bulls and bears. Some of that move was given back this week with only 36% reporting as neutral. However, that remains an elevated reading at 4.6 percentage points above the historical average. Click here to learn more about Bespoke’s premium stock market research service.
Jan 12, 2023
Initial jobless claims posted another low reading in the latest print, with national seasonally adjusted claims totaling only 205K. That was down slightly from 206K the previous week; a number revised up by 2K. After that revision, this week’s reading was the strongest showing for claims since the end of September.

Before seasonal adjustment, claims were considerably higher at 339.29K. At the end of the year and in the first weeks of a new year, claims tend to experience a significant seasonal increase which appears to be playing out in the current environment. This year’s reading is in line with the comparable weeks of the few years prior to the pandemic. As we also noted last week, this time of year tends to see the largest revisions in claims as well. In other words, from a seasonal perspective, claims can be a bit volatile in terms of actual levels and revised levels. So while the seasonally adjusted reading was solid and the non-seasonally adjusted number is nothing too concerning, the next several weeks will likely provide a clearer reading on how claims are trending.

Turning to continuing claims, this week’s print covered the final week of 2022. Like initial claims, the end of the year saw declines in continuing claims with the latest reading falling to a low of 1.634 million; the strongest level since the week of November 19th. Although that is a solid improvement following multiple months of claims rising rapidly, similary to initial claims, more weeks of data will help to provide a clearer picture given the effects of seasonality during the holidays.

We would also note, that although the drop in claims over the past two weeks has only put a small dent in the recent rise in claims, the 4.89% decline is historically large. That drop impressively ranks in the bottom 3% of all 2-week moves on record. Click here to learn more about Bespoke’s premium stock market research service.
