Mar 2, 2026
The S&P 500 opened down more than 1% to start the week after the US attacked Iran over the weekend, but the index closed slightly positive by day’s end. Yesterday we published a write-up highlighting the recent outperformance of international equities versus the US, but that script was flipped on its head today.
As shown below, key international equity ETFs like CWI (all world ex. US), EEM (emerging markets), VPL (Pacific region), and FEZ (Europe) were solidly green through February, but they fell sharply today. China (MCHI) also fell nearly 1% today, while the US (SPY) posted a small gain of 0.05%.
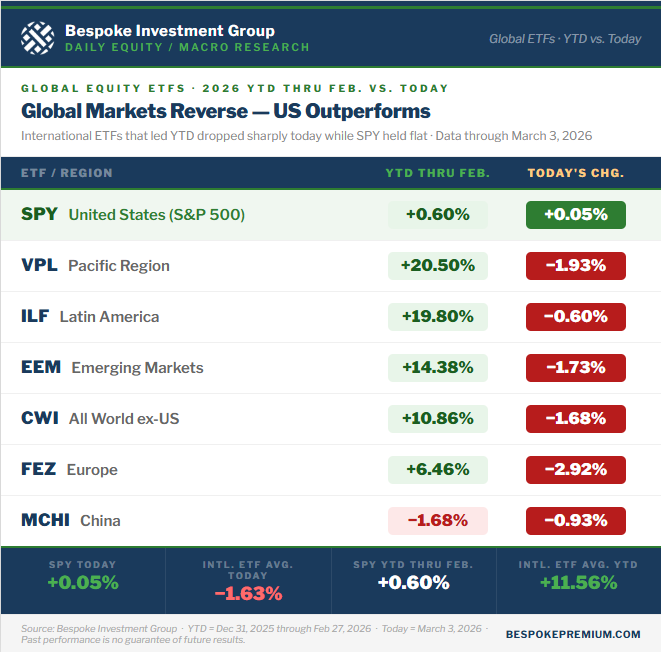
The reason for today’s global equity divergence was a spike in energy prices due to the attack of Iran. With oil and natural gas prices spiking, countries that rely on energy imports got hit hard, while the US — which is energy independent — held strong.
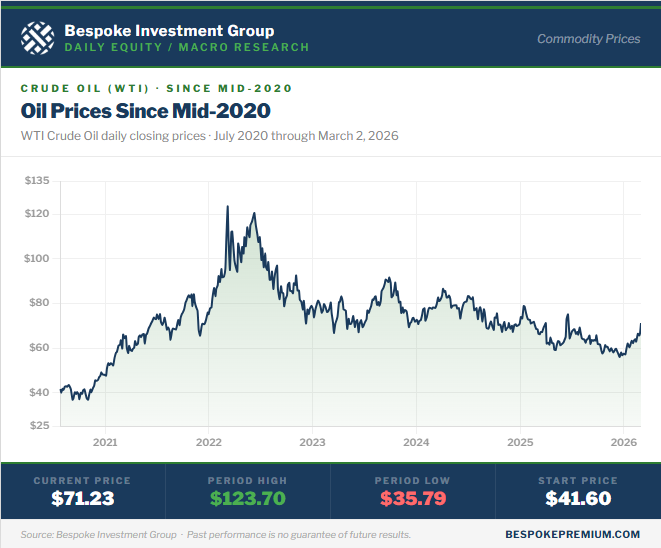
As shown below, oil prices spiked into the mid-$70s at the highs today before pulling back to close just below $72. It was a fresh six-month high for crude.
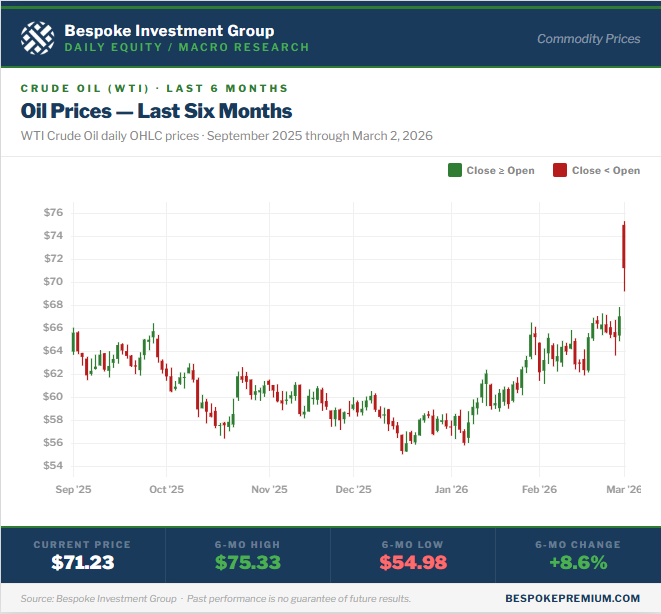
Even after today’s spike, though, oil prices remain stuck in a downtrend dating back to 2022 highs:
Like this research? Join our premium members by starting a trial today! Click below for details on how to sign up:

Mar 1, 2026
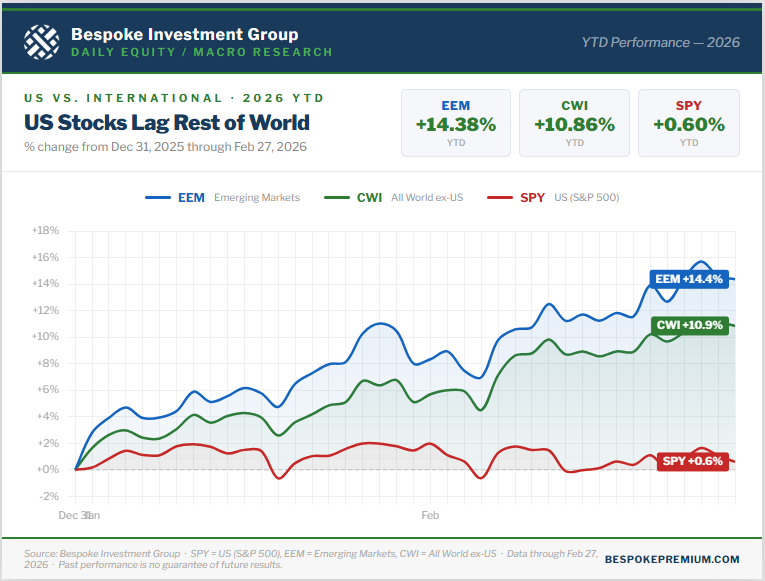
Through the first two months of 2026, the rest of the world has crushed the US when it comes to stock market performance. Using ETFs as a proxy, the US (SPY) is up just 0.6% YTD, while the MSCI All World ex US ETF (CWI) is up 10.86%. In addition to CWI beating SPY by more than ten percentage points through February, the emerging markets ETF (EEM) is up even more with a YTD gain of 14.38%.
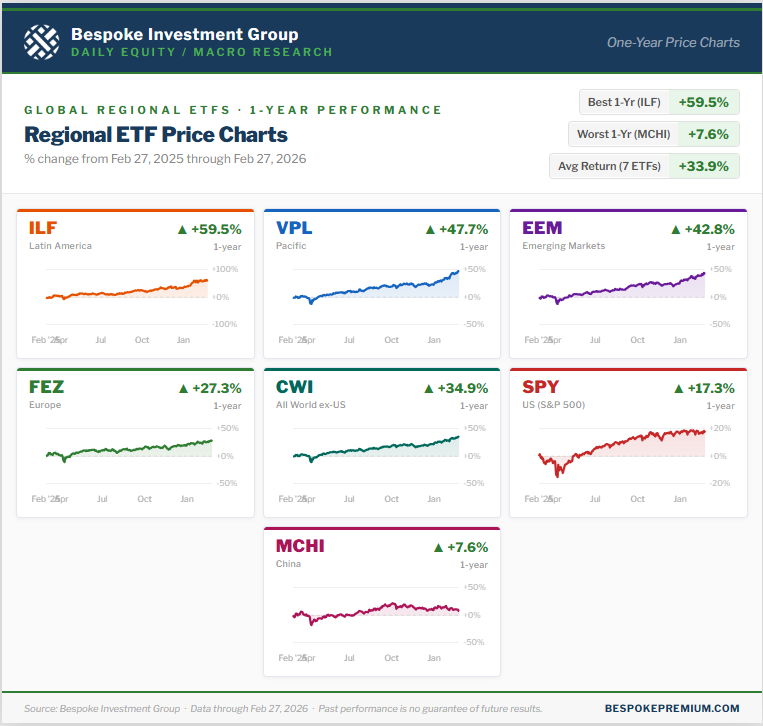
The rest of the world has outperformed the US over the last year as well. Below is a look at one-year performance for seven ETFs: the US (SPY), the rest of the world (CWI), emerging markets (EEM), Latin America (ILF), the Pacific (VPL), Europe (FEZ), and China (MCHI).
Of these seven, Latin America (ILF) leads the pack with a one-year gain of 59.5%. The Pacific (VPL) is up the second-most at +47.7%, followed by emerging markets (EEM) at +42.8%.
Europe (FEZ) is beating the US by exactly ten percentage points with a gain of 27.3% versus 17.3% for SPY. The only ETF of the group that has done worse than the US over the last year is the MSCI China ETF (MCHI).
Like this research? Join our premium members by starting a trial today! Click below for details on how to sign up:
Mar 1, 2026
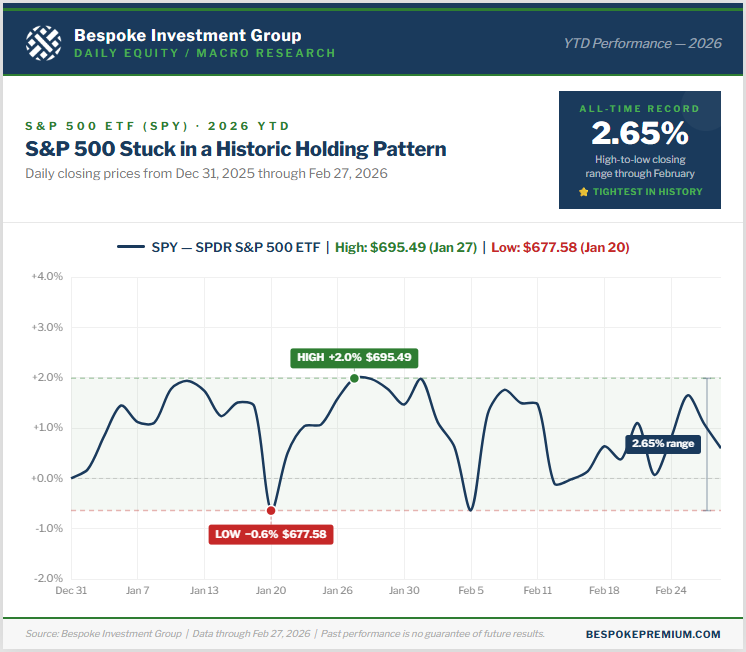
Given the massive geo-political events that have taken place this weekend with Operation Epic Fury taking out Iran’s Supreme Leader Khamenei, no one knows what will happen once the dust settles from tomorrow’s trading action. We do know, however, that 2026 has so far seen the tightest range on record for the S&P 500 through the first two months of the year.
Just 2.65% separates the S&P 500 ETF’s (SPY) highest and lowest close so far this year. That’s its tightest year-to-date high/low spread ever through February, and the same record holds for the actual S&P 500 index throughout its history.
Needless to say, the “market” as measured by the large-cap S&P 500 is a coiled spring heading into March.
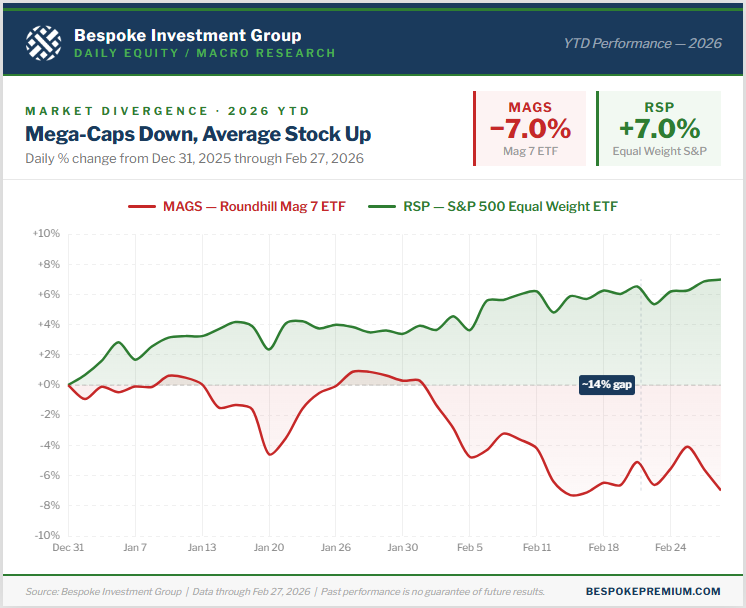
While the cap-weighted S&P 500 has been flat as a pancake this year, the average stock in the index is actually up 7%.
This means the largest stocks in the index, the mega-caps, have underperformed. The Roundhill Mag 7 ETF (MAGS) is made up of Alphabet (GOOGL), Amazon (AMZN), Apple (AAPL), Meta (META), Microsoft (MSFT), NVIDIA (NVDA), and Tesla (TSLA).
So far this year, MAGS is down 7%.
Below is a look at the huge 14-percentage point YTD performance gap between the S&P 500 Equal Weight ETF (RSP) and the Mag 7 ETF (MAGS):
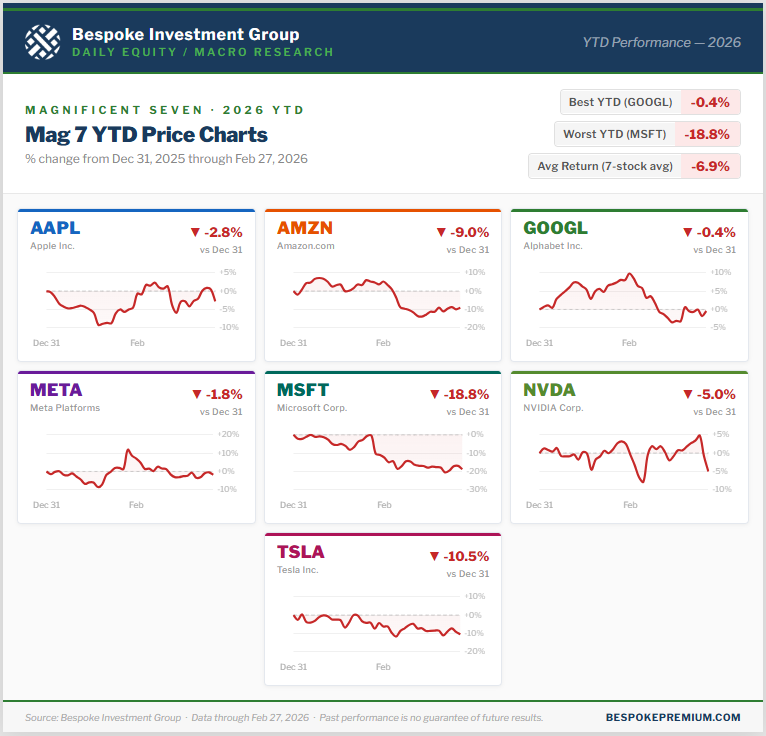
As we get set for March, not one of the Mag 7 stocks is up on the year. As shown below, Alphabet (GOOGL) has been the best performer of the group this year with a small decline of 0.4%. On the flip side, Microsoft (MSFT) is down the most with a decline of 18.8%.
With such big concentration at the top of the S&P 500, investors have been worried that weakness in the mega-cap cohort would inevitably take down the rest of the market. During the recent Mag 7 sell-off, the rest of the market has stepped up enough to essentially keep the major cap-weighted indices flat.
Like this research? Join our premium members by starting a trial today! Click below for details on how to sign up:
Feb 27, 2026
Publicly-traded private equity stocks are taking it on the chin again today, continuing an extremely rough stretch for the group that began in early January. The reason for the recent plunge: fears of over-exposure to software companies that are suddenly at risk of extinction from AI.
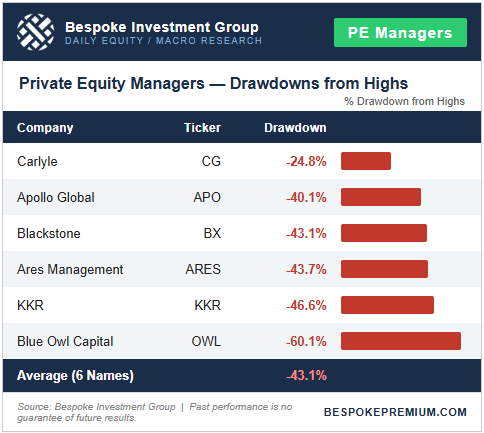
A group of six alternative asset companies that includes well-known firms like Apollo (APO), KKR (KKR), and Blue Owl (OWL) is now in an average drawdown of 43.1% from all-time highs, which were hit in November 2024 shortly after President Trump was re-elected.
Carlyle Group (CG) has so far been spared the most with a drawdown of only 25%. The other five stocks in the table below are all down 40%+ from highs. Blue Owl Capital (OWL) is down by far the most at -60.1%.
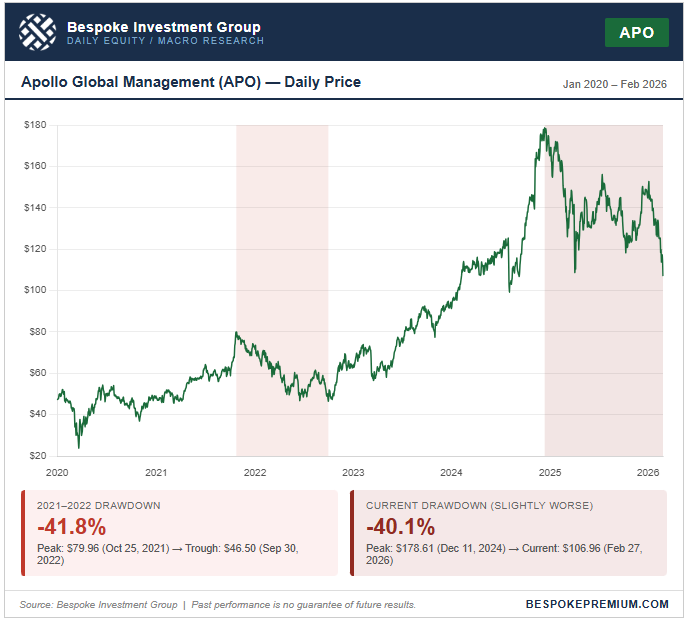
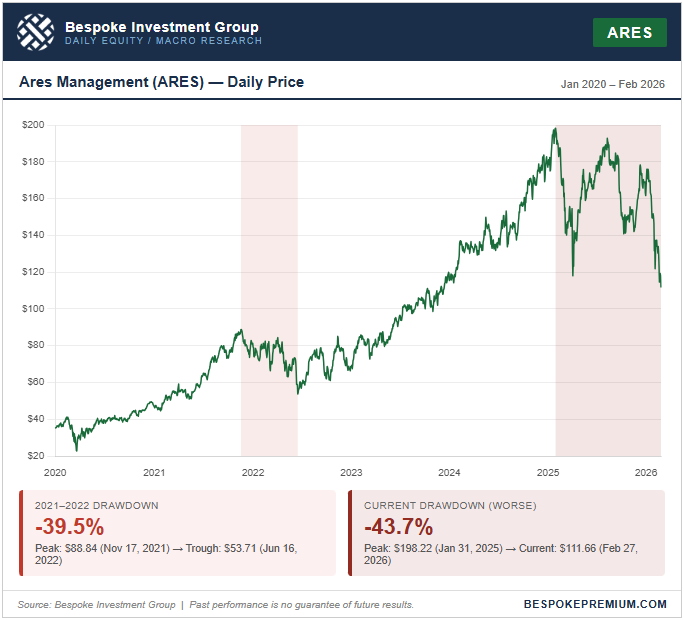
Below are price charts for two of the PE companies in the table above going back to 2020: Apollo (APO) and Ares (ARES).
What’s important to highlight is that the current drawdown in the private equity space is now just as extreme as the one seen during the nasty bear market of 2021/2022 when the SPAC/meme-stock bubble burst. As shown, Apollo (APO) is down 40.1% now versus a peak to trough decline of 41.8% in 2022, while Ares (ARES) is down 43.7% from its November 2024 all-time high versus a drop of 39.5% during the 2021/2022 bear market.
Back in 2022, the broader market fell in lockstep with PE stocks, as the S&P ultimately fell 25% and the tech-heavy Nasdaq 100 fell 35%. So far during the current PE sell-off, the Nasdaq 100 is down less than 5%, while the S&P 500 is 1.5% below all-time highs.