
An April to Remember for Stocks
Below is a snapshot of key ETF performance across asset classes for the month of April and so far year to date.
The S&P 500 (SPY) jumped more than 10% in April for its best month since November 2020. The Tech-heavy Nasdaq 100 (QQQ) did even better with a gain of 15.7%, while the Dow 30 (DIA) was up a more modest 7.7%.
Growth outperformed value, and dividend stocks lagged badly.
The Tech sector ETF (XLK) gained more than 20%, while the semis (SMH) gained 32%! On the downside, both Health Care (XLV) and Energy (XLE) actually finished the month in the red.
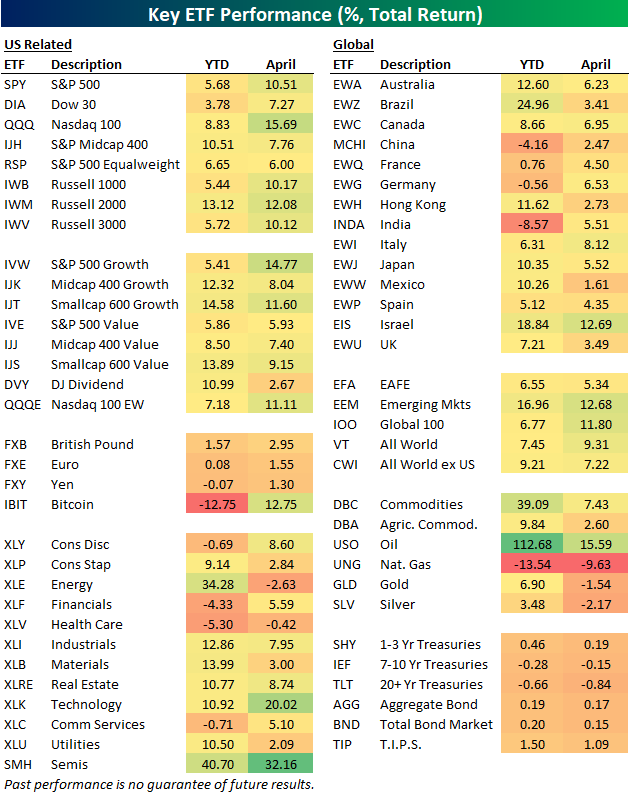
Country ETFs gained in April, but they didn’t gain nearly as much as the US. Oil (USO) rallied 15.6%, but natural gas (UNG), gold (GLD), and silver (SLV) were all down. Longer duration Treasury ETFs were slightly lower in April, but the bond market as a whole (AGG, BND) was up 15 bps.
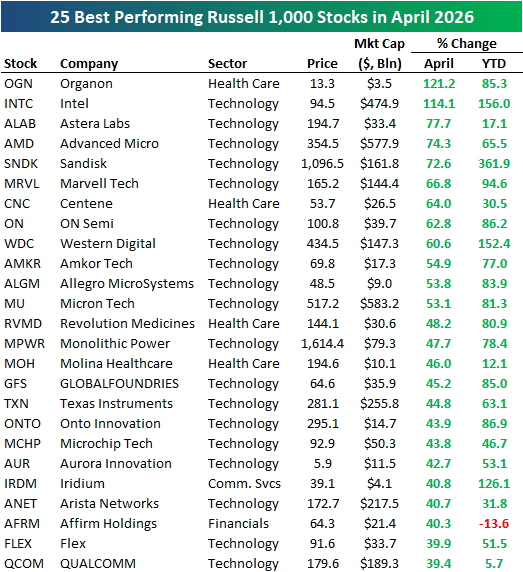
There were some historic moves for individual stocks in April, including two Russell 1,000 stocks that more than doubled: Organon (OGN) and Intel (INTC).
Intel began April with a market cap of roughly $222 billion. It ended the month with a market cap of $474.9 billion.
As shown in the table below, Tech stocks dominated the list of April winners, making up 19 of the top 25 performers. Other notable winners include Astera Labs (ALAB), Advanced Micro (AMD), and Sandisk (SNDK) — all up 70%+.
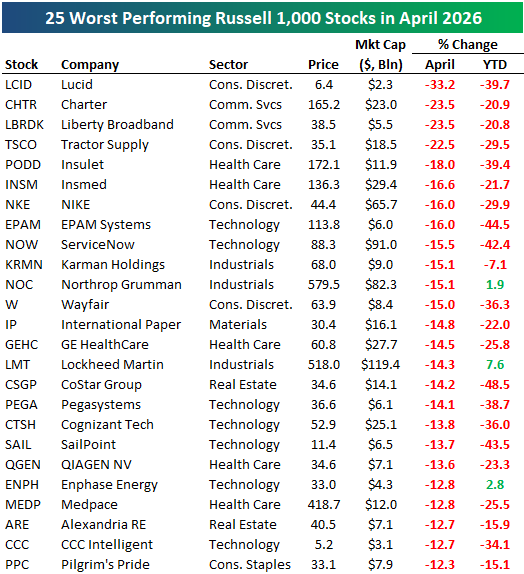
Of course, not all stocks went up in April. Below are the 25 worst performers in the Russell 1,000 during the month, led by Lucid (LCID) with a 33% drop. Charter (CHTR), Liberty (LBRDK), and Tractor Supply (TSCO) all fell more than 20%, while other notables on the list of April losers include NIKE (NKE), Wayfair (W), ServiceNow (NOW), and Northrop Grumman (NOC).
Like this analysis? Join our Think BIG mailing list or Bespoke Premium by starting a trial today! Click below for details on how to sign up for Premium:

New York Alone at the Top
S&P Cotality released its monthly Case Shiller home price data earlier this week, and below is a table highlighting some of the recent trends (through February) across the 20 major metros they track.
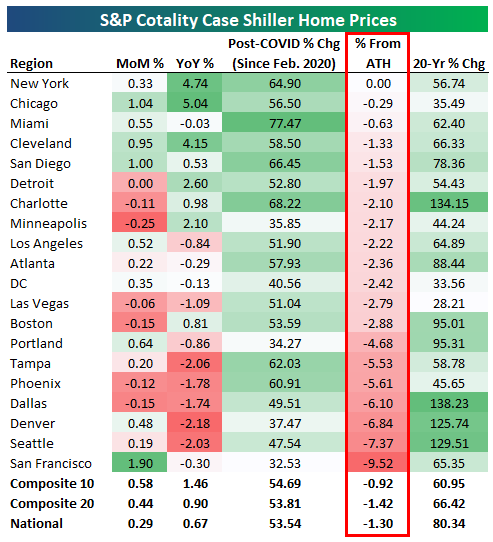
Thirteen of twenty cities were up month-over-month, with San Francisco seeing the biggest jump at 1.9%. A few cities had minor m/m declines like Minneapolis, Boston, Dallas, and Phoenix.
On a year-over-year basis, just eight of twenty cities are higher, led by Chicago, New York, and Cleveland.
Tampa, Denver, and Seattle are down the most y/y with declines of just over 2%.
Lastly, we wanted to point out where cities stand relative to all-time highs. After a brief dip in prices from late 2022 to early 2023, most cities bounced back and made a series of higher highs throughout 2024 and early 2025.
But prices peaked for most cities in the middle of last year, and they’ve seen a slow trickle lower since.
As shown in the table, the only city that’s still at all-time highs for home prices is the Big Apple, where current NYC Mayor Mamdani has just recently proposed a new pied-à-terre tax on second homes worth more than $5 million.
Like this analysis? Join our Think BIG mailing list or Bespoke Premium by starting a trial today! Click below for details on how to sign up for Premium:
The Bespoke 50 Growth Stocks – 4/30/26
The “Bespoke 50” is a basket of noteworthy growth stocks in the Russell 3,000. To make the list, a stock must have strong earnings growth prospects along with an attractive price chart based on Bespoke’s analysis. There were seven changes to the list this month.
The Bespoke 50 is available with a Bespoke Premium subscription or a Bespoke Institutional subscription. With Bespoke Premium, you’ll receive a number of daily market updates from us along with our weekly newsletter and a portion of our investor tools. With Bespoke Institutional, you’ll receive everything that’s included with Premium plus additional daily macro analysis and more stock-specific research.
To see all 50 stocks that currently make up the Bespoke 50, simply start a two-week trial to Bespoke Premium or Bespoke Institutional.
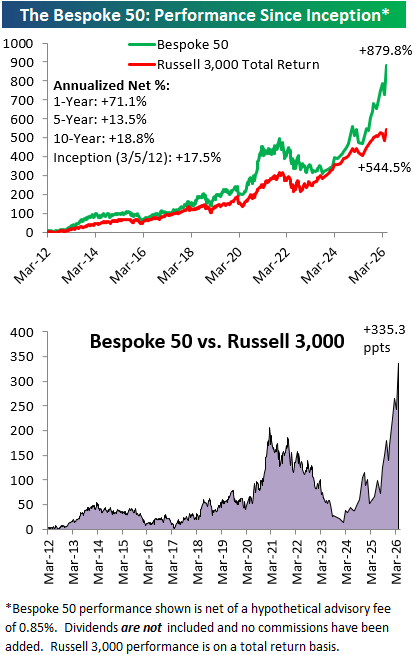
The Bespoke 50 performance chart shown does not represent actual investment results. The Bespoke 50 is updated monthly on Thursdays unless otherwise noted. Performance is based on equally weighting each of the 50 stocks (2% each) and is calculated using each stock’s opening price as of Friday morning after publication. Entry prices and exit prices used for stocks that are added or removed from the Bespoke 50 are based on Friday’s opening price. Any potential commissions, brokerage fees, or dividends are not included in the Bespoke 50 performance calculation, but the performance shown is net of a hypothetical annual advisory fee of 0.85%. Performance tracking for the Bespoke 50 and the Russell 3,000 total return index begins on March 5th, 2012 when the Bespoke 50 was first published. Past performance is not a guarantee of future results. The Bespoke 50 is meant to be an idea generator for investors and not a recommendation to buy or sell any specific securities. It is not personalized advice because it in no way takes into account an investor’s individual needs. As always, investors should conduct their own research when buying or selling individual securities. Click here to read our full disclosure on hypothetical performance tracking. Bespoke representatives or wealth management clients may have positions in securities discussed or mentioned in its published content.