Jul 5, 2022
The S&P 500 is down 20.8% on a YTD basis, which is worse than all of the international indices we looked at apart from the DAX (German stock market index) and ITLMS (Italy stock market index). Although the YTD performance is weak relative to other countries, performance relative to pre-COVID levels is still elevated, so long-term investors have been rewarded by investing in the US. Relative to mid February of 2020 just before COVID hit the West, the S&P 500 ranks third out of the 12 indices we looked at, falling short of just Argentina (Merval) and Chile (IGPA). Click here to learn more about Bespoke’s premium stock market research service.
Of the 12 international indices, eight are down relative to pre-COVID levels. The biggest decliners have been Hong Kong (Hang Seng), Spain (IBEX 35) and Italy (ITLMS). The charts below show the five year performance of each international index that we looked at (and the S&P 500). As you can see, five year returns are now negative for the DAX, the Hang Seng, the FTSE Italia, the IBEX 35 and the FTSE 100. So much for the benefits of international diversification!


The table below summarizes each index’s performance over the last five years, relative to pre-COVID levels, and on a YTD basis. Much of the differentiation in performance can be attributed to the means of each respective economy. For example, Argentina and Chile largely export materials, making the economies highly correlated to price moves in commodities. On the other hand, Western nations tend to have a healthy mix of industrial products, commodities and services. Click here to learn more about Bespoke’s premium stock market research service.

Jul 5, 2022
We track the number of NICS firearm background checks on a regular basis as it often provides interesting insights on the mood of Americans or the direction of political winds regarding gun control legislation. In times of higher volatility, uncertainty, or concerns that lawmakers in Washington will enact stricter legislation for firearms, purchases tend to rise. On the other hand, in periods of stability, background checks tend to fall. Ever since June of last year, background checks have been declining on a y/y basis, but the y/y decline moderated in June. Although still down 15.8% compared to last year, purchases moved higher sequentially for the first time in three months. Click here to learn more about Bespoke’s premium stock market research service.
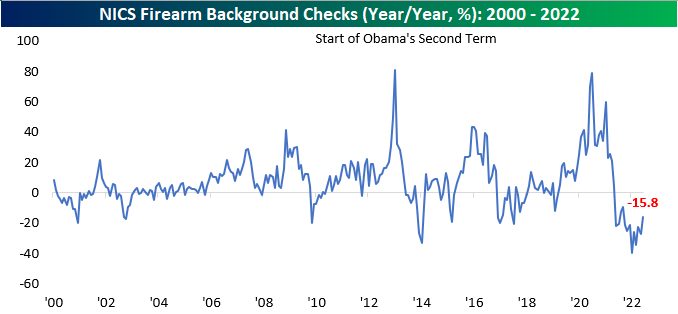
Although checks moved higher month over month, they are likely to rise even further in July due to the Supreme Court’s recent ruling against the state of New York. This case expands the right to carry, and will likely increase firearm purchases in some of the most restrictive cities, such as New York and Los Angeles. In June, background checks rose by over 230K to reach 2.6 million. Although checks are in a near-term down-trend following the COVID spike, the longer-term uptrend is still very much intact.

On a YTD basis, background checks have declined at the fastest rate on record. This is largely due to elevated comps, as 2021 saw background checks near record levels due to a growing political divide, COVID lockdowns, and fears over legislation with Democrats in full control of Washington D.C.

Although background checks moved higher month over month, Sturm Ruger (RGR) and Smith and Wesson (SWBI) hit 52-week lows in June. All-in-all, RGR traded 6.3% lower in June, and SWBI declined 15.2%. The stocks have been weighed down by slowing sales over the last couple of quarters, increased legal risk associated with firearm manufacturer liability, and the pull of the overall market tide. Both these stocks are still in sustained downtrends, and even after initially moving higher following the Supreme Court decision, both stocks have essentially come full circle. Click here to learn more about Bespoke’s premium stock market research service.


Jun 30, 2022
Whether you’re looking at monthly, quarterly, or first-half performance, this year’s S&P 500 performance has been quite weak. As investors, we must avoid falling into the sunken-cost fallacy and are forced to be forward-looking.
Starting with weak months, there have been a total of 83 months in the post-WWII era in which the S&P 500 declined at least 5%. In fact, this has occurred three times in 2022 alone, and if the current pace continues will top the post-WWII high in 2008 when there were five months of 5%+ declines. Click here to learn more about Bespoke’s premium stock market research service.

In addition to 5%+ monthly declines, we also looked at periods where the S&P 500 declined 10%+, as well as six-month periods when the S&P 500 fell 20%+ (with no prior occurrences in the last three months). Over the following day, performance was inline with the historical average following 5%+ monthly declines and 10%+ quarterly declines, but the first trading day following a six-month decline of 20%+ was much better than the historical average. Over the following week and month, though, the picture looks different as performance after 10%+ quarterly declines has been much better than average while performance following 20%+ six-month declines has been well below average. In terms of the week and month after 5%+ monthly declines, returns have pretty much been in line with the historical average.

Taking a look at positivity rates (percent of the time the S&P 500 has posted gains in a respective period), the S&P 500 has boasted above average rates following a monthly decline of 5%+ in both the next day and month, but rates are lower over the following week. After quarterly declines of 10%+, positivity rates were lower in the following day, but above average for the following week and month, coming in at 61.9% and 71.4%, respectively. On the downside, positivity rates were much lower following the first rolling six month decline of 20%+ in the next week and month, coming in at 40.0% for both. Investors should note that the first occurrence of a 20%+ rolling six month decline occurred on June 16th. Click here to learn more about Bespoke’s premium stock market research service.

Jun 30, 2022
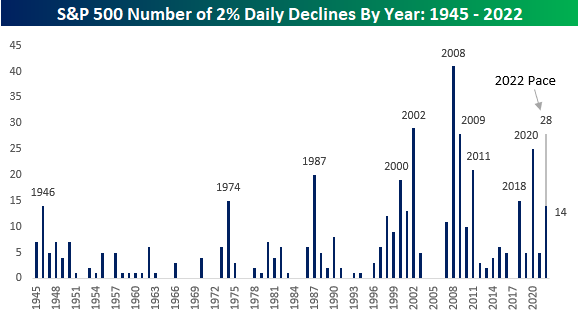
2022 has seen the bulls get slugged with a number of heavy blows. The S&P 500 has already experienced 14 separate one-day declines of 2% or more this year. That’s nine more than the entire total for 2021!
While there are still another six months left in the year, only ten other years have seen as many or more 2% daily declines in their entirety! At the current pace, 2022 would see 28 daily declines of 2%+, which would rank as tied with 2009 for the third most in the post-WWII period trailing only 2002 (29) and 2008 (41). Not great company. If 2021 was the year where nothing could go wrong for investors, 2022 has been the year where nothing is going right. Click here to learn more about Bespoke’s premium stock market research service.
Jun 30, 2022
After two weeks of sub-20% readings, the share of respondents to the AAII sentiment survey reporting as bullish has risen back up to 22.8%. That increase in optimism comes on what has been pretty choppy price action in the past week as the S&P 500 had risen then given up roughly 3% since the last update of the AAII numbers.
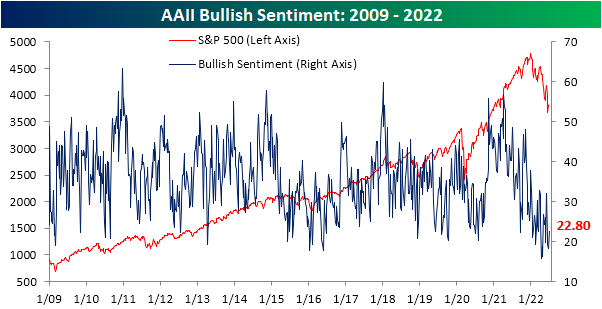
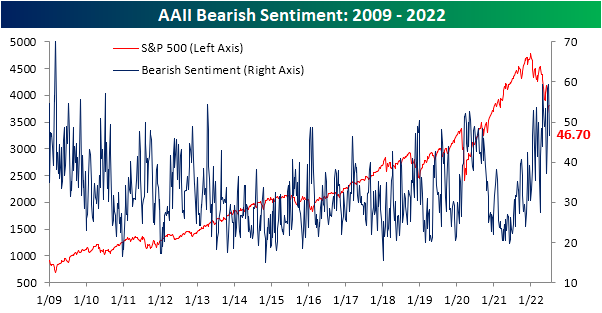
The increase in bullish sentiment broke a streak of back-to-back-to-back declines, and the opposite shift in sentiment could be seen for bearish sentiment. The percentage of respondents reporting as pessimists fell by 12.6 percentage points in the latest week bringing the reading back below 50%. While the double-digit decline was large, the first week of June actually saw an even bigger drop of 16.4 percentage points.
The significant inverse moves in bullish and bearish sentiment have resulted in the bull-bear spread to move higher, but at -23.9, sentiment continues to heavily favor the bears.

In fact, taking a four-week moving average of the bull-bear spread shows that the reading has been below -10 (meaning on average bears have outnumbered bulls by at least 10 percentage points) for 23 straight weeks. That continues to close in on the record six-month streak that ended in February 1991 as bulls are few and far between.

Given the drop in bears this week was far larger than the increase in the number of respondents reporting as bullish, the bulk of the sift went to the neutral camp. That reading rose 8 percentage points to 30.5%. While that only leaves the reading at the highest level since the week of June 9th, it was the largest one-week increase since the last week of March and ranks in the top decile of all week-over-week moves on record. Click here to learn more about Bespoke’s premium stock market research service.
