Jul 25, 2022
See what’s driving market performance around the world in today’s Morning Lineup. Bespoke’s Morning Lineup is the best way to start your trading day. Read it now by starting a two-week trial to Bespoke Premium. CLICK HERE to learn more and start your trial.
“It’s a recession when your neighbor loses his job; it’s a depression when you lose yours.” – Harry Truman

Below is a snippet of content from today’s Morning Lineup for Bespoke Premium members. Start a two-week trial to Bespoke Premium now to access the full report.
The weather has been hot across much of the country the last several days, and that heat will move to the markets this week with a busy schedule of economic data, peak earnings season, and the FOMC announcing its latest policy decision.
Ahead of the kickoff of trading, equity futures and bond yields are modestly higher along with crude oil and copper. On the downside, Bitcoin is down over 3% while gold is flat. Over in Europe, Germany’s ifo index tracking the business climate fell more than expected as a recession looks increasingly likely.
Today’s Morning Lineup discusses earnings news out of Europe and the Americas, economic data from around the world, and much more.
With all the earnings and economic data on the calendar this week, investors will likely have a much better read on the economy and its direction on Friday. Several indicators have already pointed to the increased likelihood of a recession, and the yield curve has also been indicating a more precarious economic picture. While the spread between the yields on the 10-year and 2-year US Treasuries has been negative for three weeks now, the spread between the 10-year and the 3-month yields has yet to move to inverted levels. A few months ago, the relative steepness of the Fed’s preferred yield curve measure was cited as a reason why a recession was not in the cards. However, after flattening by nearly 200 bps to just 40 bps in the last three months, even this part of the curve (light blue line) looks much less comforting.

Start a two-week trial to Bespoke Premium to read today’s full Morning Lineup.
Jul 14, 2022
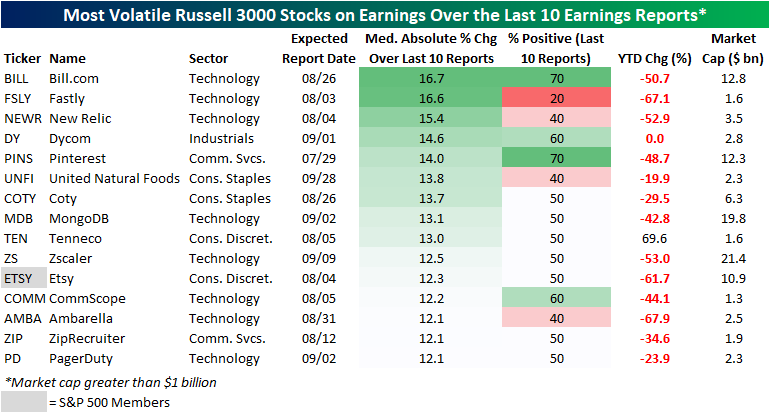
With earnings season kicking off, we wanted to highlight Russell 3000 stocks that in recent history have been the most volatile in reaction to earnings (over the last ten quarters). In order to be included in this list, a stock must have reported at least ten quarters since going public and must also have a market cap over $1 billion. The list includes tech companies, e-commerce players, food producers, and more. On average, these stocks are down 35.1% on a YTD basis (median: -44.1%), which is notably worse than the overall market. We measured volatility by the median absolute percent change on earnings reaction days over the last ten quarters, and these names averaged a move of 13.6% in either direction on their earnings reaction days. The most volatile name has been Bill.com (BILL), followed by companies like Fastly (FSLY), New Relic (NEWR), Dycom (DY), and Pinterest (PINS). Only one of the stocks outlined below is in the S&P 500 (Etsy), and none have a market cap of more than $21.4 billion.
Of course, volatility does not imply direction. Of the 15 stocks outlined below, two – BILL and PINS – have seen seven of their last ten reports result in gains on their earnings reaction day. On the other end of the spectrum, four stocks have seen positivity rates of 40% or less over the last ten reports: Fastly (FSLY), New Relic (NEWR), United Natural Foods (UNFI), and Ambarella (AMBA). If you own any of these names, be prepared for a potentially sharp reaction to earnings (in either direction) when they report this earnings season. Click here to learn more about Bespoke’s premium stock market research service.
Just to show you what we mean, the graphic below shows BILL’s (the most volatile name on the above list) earnings reactions over the last 10 quarters. As you can see, eight of its last ten reports have been followed by a one-day reaction of 10%+, including four moves of more than 20%! Click here to learn more about Bespoke’s premium stock market research service.

Jul 12, 2022
As of today, the percentage of inverted points on the yield curve reached the YTD highs seen in mid-June of 17.9%. This comes as the 10-year and 1-year invert, as well as the 5-year and 2-year. The inversion of points on the yield curve (particularly 2s&10s) tends to be cited as a leading recession indicator, due to the fact that higher near-term yields imply a higher risk in the near-term rather than the long-term, the inverse of what is typically true. The graph below shows the rolling percentage of inverted points on the curve over the last six months. Click here to learn more about Bespoke’s premium stock market research service.

As mentioned above, the spread between the 10-year and 1-year treasury inverted today, which is the first occurrence since October of 2019. Following prior inversions of this part of the yield curve since 1970, a recession has followed in the next two years 99.8% of the time which would suggest that a recession at some point in the next two years is almost certain. Following the first inversion in at least one year when a recession did follow, it has taken an average of 271 trading days to officially enter a recession. The shortest time it took to enter into a recession following 1s and 10s inversion was in 1973, when it took just 191 trading days. As mentioned, going back to 1970, recessions have followed within two years of an inversion 99.8% of the time. The only time that this part of the curve inverted and a recession did not follow within two years was after a brief stint in the fall of 1998.

Jul 6, 2022
Investors often turn to Gold as a safe asset in tumultuous times, as the asset tends to hold its value during market downturns. For example, when the S&P 500 sold off by 34.1% during the COVID Crash, the SPDR Gold Trust (GLD) declined just 3.6%. In 2022, GLD initially acted as a strong hedge to the equity market, gaining 1.0% on a YTD basis on June 16th as SPY entered bear market territory. However, GLD topped out in early March and is now trading 14.0% off of its closing 2022 high. GLD has even underperformed SPY since March 8th, declining 14.0% versus SPY’s drop of 8.2%. Click here to learn more about Bespoke’s premium stock market research service.
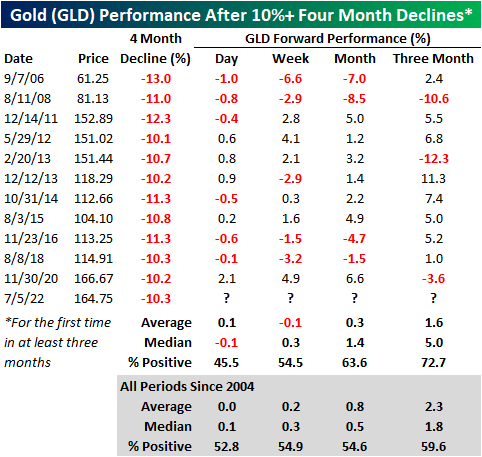
Over the last four months, GLD has declined by 10.3%, which is elevated for a relatively stable asset during a bear market. Since its inception in 2004, GLD has declined 10% or more over a four-month period (with no occurrences in the prior three months) twelve times with each occurrence shown in the chart below.

The forward performance following four-month declines of 10%+ has been mixed depending on the time frame. The next day (which would be today), GLD has booked a median loss of 10 basis points, gaining just 45.5% of the time. However, the median return and positivity rate in the next week is inline with historical averages. Over the one and three months, performance tends to pick back up, registering gains 63.6% and 72.7% of the time, respectively. Over the next three months, GLD has had a median gain of 5.0%, which is more than two and a half times the median of all periods. Click here to learn more about Bespoke’s premium stock market research service.
Jul 6, 2022
Up until June 8th, the Energy sector was the only thing working in the market. However, the sector has reversed dramatically, falling close to 25% since. This comes as the price of oil pulls back and the White House targets the entire vertical with accusations of profiteering. As any investor knows, the price of oil is not set by individual energy companies, but rather by the forces of the market. Interestingly, the same administration that is pressuring oil companies to increase supply campaigned on the fact that they would not allow for drilling permits to be renewed on federal land, so the current rhetoric is… interesting to say the least. To quote Biden himself: “Number one, no more subsidies for the fossil fuel industry. No more drilling on federal lands. No more drilling, including offshore. No ability for the oil industry to continue to drill, period.” Rhetoric like this can logically cause a reduction in domestic energy investments, as CFO’s adjust capital expenditures based on added legislative risk.
Nonetheless, the price of oil has pulled back significantly, which causes a compression in gross margins for suppliers. Oil is currently trading at about $100 per barrel. Although oil is still up over 33% YoY, it has pulled back by 23.3% relative to highs. Most industries will breath a sigh of relief, but energy companies will be in the other camp. Notably, crude recently broke its uptrend, and seven of the last 15 trading days have seen declines of 3% or more.

Below is a chart showing the rolling % of 3%+ daily declines over all 15-day periods. As you can see, this is an extremely elevated reading, surpassed by just The Great Recession and the COVID Crash. Following the high reading in 2008, XLE rebounded 8.9% in the next week and 7.8% over the next month. In March of 2020, XLE fell by an additional 13.1% over the next week, but rebounded 14.7% over the following month after the peak reading.

Below are snapshots of S&P 500 Energy stocks as they currently stand versus where they stood on June 8th when XLE peaked. All but one of the stocks have entered an oversold range after every single one was overbought as of 6/8. What a difference a month can make! On average, these stocks were up 66% YTD (median: 64.8%) on June 8th, but are now up an average of just 22.3% on a YTD basis (median: 18.0%). Between the close on 6/8 and 7/5, the average stock on this list fell by 26.1% (median: -26.7%), delivering pain to investors who bought the rip. Click here to learn more about Bespoke’s premium stock market research service.

