Aug 17, 2022
Just as the S&P 500 ran into some resistance yesterday at its 200-day moving average (DMA), we’ve seen the same pattern play out in a number of commodities. Two of the more high-profile ones have been copper and crude oil.
Copper fell out of bed in the late spring and early summer, losing a third of its value. Along with the equity market, copper has seen a late-summer rally, but things came to a screeching halt right at the 50-DMA last Thursday. Copper has been down on two of the last three trading days and hasn’t been able to trade back above that elusive 50-DMA since. Click here to start a two-week trial to Bespoke Premium and receive our paid content in real-time.

Crude oil has been just as weak as copper lately, trading in a well-defined downtrend and breaking below its 200-DMA in early August. There was a little bit of a bounce last week, but resistance came into play at the 200-DMA, and after making another lower high, it has since made another lower low.
When stock, commodity, bond, or any other asset class is in a well-defined downtrend, the first thing they have to do to break out of their funks is clear resistance at key moving averages like the 50 and/or 200-DMA. In the case of copper and crude, they have both recently come up short. The S&P 500, again, is facing some resistance at its 200-DMA, but at least it has managed to clear its 50-DMA which it did in the second half of July.

Aug 16, 2022
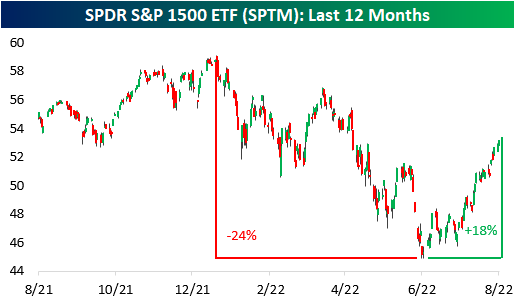
Today marks two months since the mid-June low. At the time, the S&P 1500 had declined 23.5% relative to the January 3rd high. Since then, the index has recovered substantially, gaining 17.7% off of the low. Although the S&P 1500 is still 10.0% off of its closing high, these gains have been well received by investors as the market has shown resilience in the face of rampant inflation, worsening housing data, rate hikes, supply chain constraints, and increased labor costs. This rally comes as oil prices pull back, CPI came in lower than estimated for the month of July, and earnings come in better than expected. The graph below shows the price moves in the SPDR S&P 1500 ETF (SPTM) over the last twelve months. Click here to start a two-week trial to Bespoke Premium and receive our paid content in real-time.
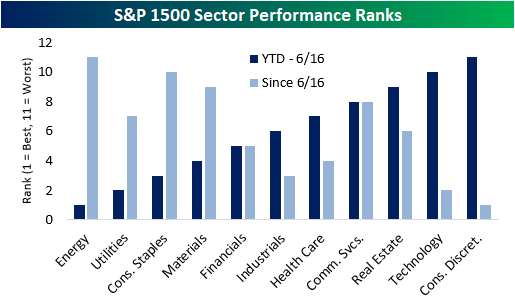
Since the June low, there has been a reversal in performance trends, as the laggards have tended to lead the way higher (on a percentage basis) while the former leaders have generally lagged. Between the start of the year and the 6/16 low, Energy and Utilities were the best performing sectors, while Technology and Consumer Discretionary were the worst. Since then, we have seen the inverse as Technology and Consumer Discretionary have been the top-performing sectors while Energy has been the worst.
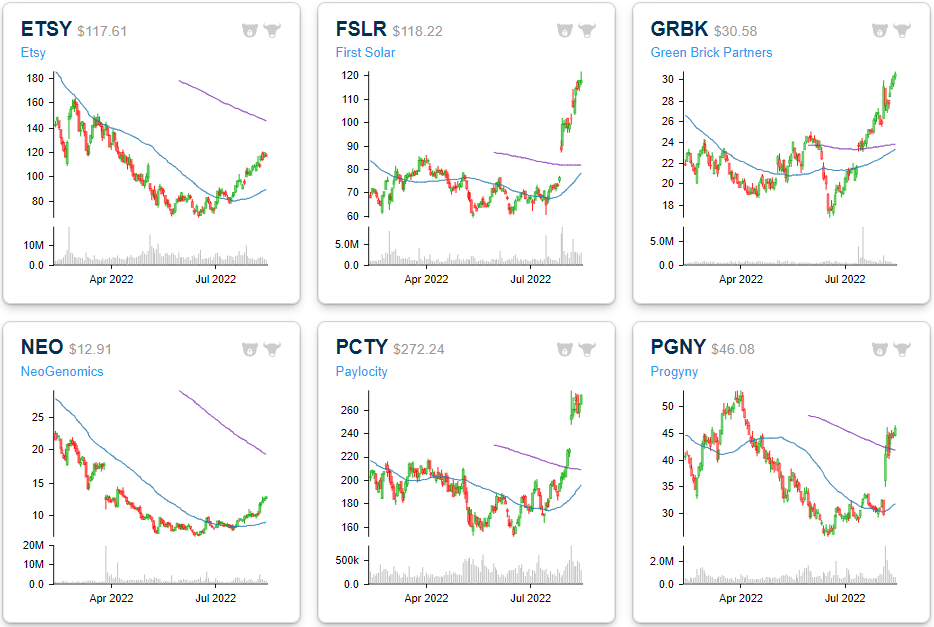
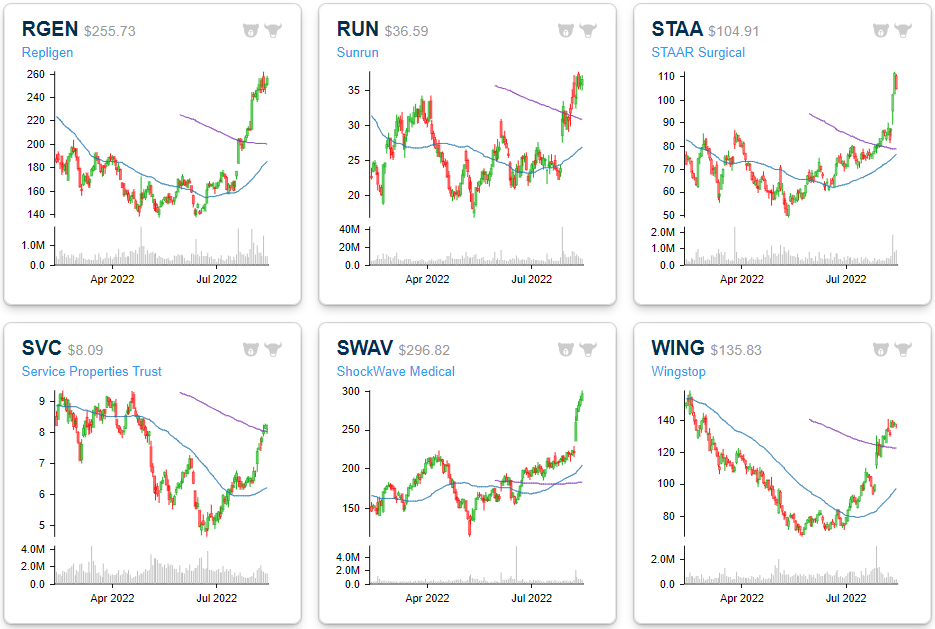
The chart below shows the 25 best-performing S&P 1500 stocks since the 6/16 low. As you can see, these stocks generally underperformed the broader index until the low, trading down by an average of 46.9%. However, since the lows, they are up an average of 90.4%, led by the newest meme stock: Bed Bath & Beyond (BBBY). Due to the drawdowns through 6/16, these stocks are still down YTD on a median basis (and even on an average basis), but they are an average of 47.6% above their 50-DMAs and 22.3% above their 200-DMAs. They’ve come a long way, and shown in the charts below, many have reached some extremely stretched levels, but even after the rallies, they still have a ways to go before coming out of the darkness. Click here to start a two-week trial to Bespoke Premium and receive our paid content in real-time.
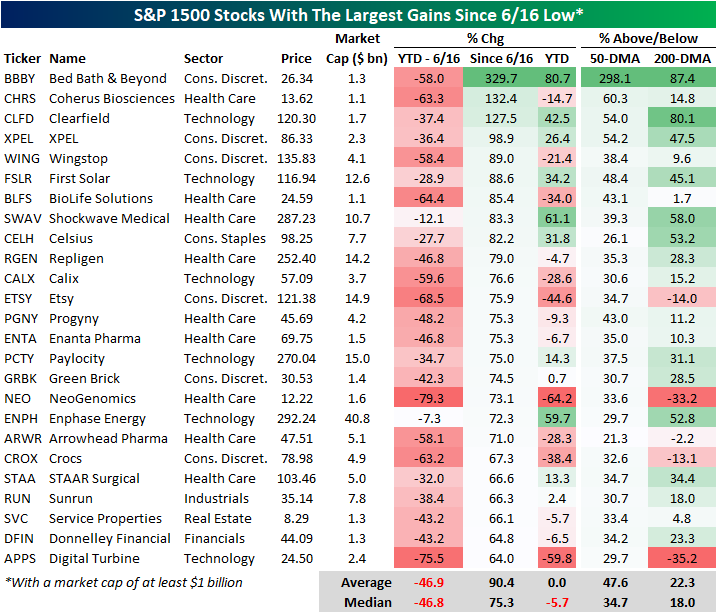
Six-month price charts for each of these stocks are included below. You can track a custom portfolio of these names by clicking here.


Aug 15, 2022
On Friday, the S&P 500 rallied 1.7% to round off the fourth straight week of gains. Relative to the mid-June lows, the index has rallied 16.7%, a notable move as YTD weakness subsides (at least for now). With Friday’s move, the S&P 500 also closed more than two standard deviations above its 50-day moving average for the first time since 12/29/21, marking the end of a 155-day trading day streak in which the index did not close at ‘extreme’ overbought levels.

A streak of this length had not been reached since 2015, and the longest streak since WWII ended in 2003 (768 trading days). All in all, there have now been 27 streaks since WWII where the S&P 500 went at least six months without registering a close in ‘extreme’ overbought territory. Click here to start a two-week trial to Bespoke Premium and receive our paid content in real-time.
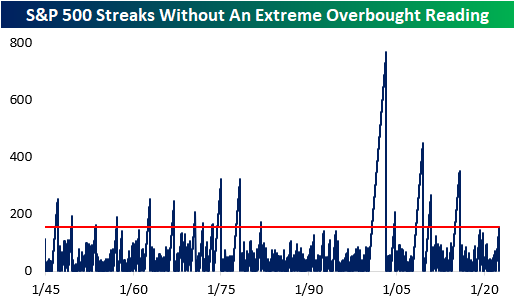
For investors who are long equities, it’s hard not to like the way stocks have performed in recent weeks. However, with the market reaching overbought levels after a sharp rally, fears of a pullback increase as moves of this magnitude may be unsustainable. Historically speaking, median returns following the end of prior streaks without an ‘extreme’ overbought reading that lasted at least six months have, in aggregate, been followed by decent returns. For every time period we looked at (next day, next week, one month, three months, and six months), median returns were positive and better than the historical average for all comparable time periods since WWII. Over the next three months, for example, the S&P 500’s median performance was a gain of 4.4% which is 1.8 percentage points better than the historical average for all six-month periods. From a historical perspective at least, when equities reach ‘extreme’ overbought levels after a prolonged period without a similar reading, fears of an imminent reversal were typically unwarranted.

Positivity rates tend to be superior as well, apart from one month forward. Over the next week (which would be through the end of the week in this case), the S&P 500 has performed positively 77% of the time, which is 20 percentage points higher than that of all periods. Over the next three and six months, the positivity rate has been 73%, which is also quite positive. Click here to start a two-week trial to Bespoke Premium and receive our paid content in real-time.

To paint the full picture, the maximum drawdown following these occurrences was in November of 1981, when the S&P 500 fell by 10.8% over the next three months and 11.6% over the following six months. On the flip side, the best performance occurred following the January of 1975 occurrence, when the index went on to gain 14.4% and 17.7% over the next three and six months, respectively. Over the following month, the data has a range of -7.1% to +6.6%. Click here to start a two-week trial to Bespoke Premium and receive our paid content in real time.
Aug 12, 2022
After another busy week for the markets, we wanted to highlight some of our favorite charts that we published for paying subscribers. Enjoy! Click here to start a two-week trial to Bespoke Premium and receive our paid content in real time.
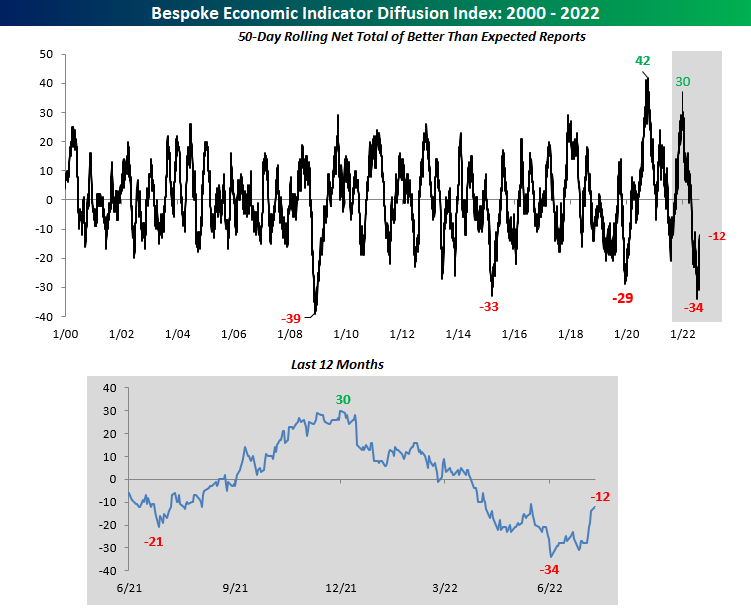
We started off the week by looking at our economic indicator diffusion index, which measures the pace at which economic indicators are coming in ahead (or below) consensus economist estimates over a 50-day period. In late June, this index hit a low that had not been seen since the great financial crisis, but it’s now 22 points above this level. It seems as if economists are struggling to predict economic data points, as the index has seen extremes in both directions since the onslaught of the pandemic.
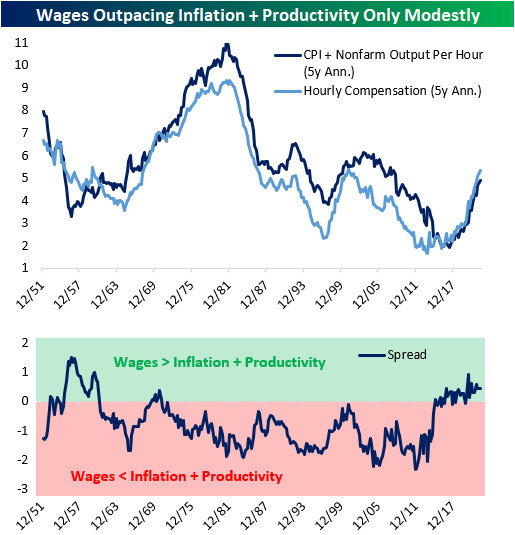
On Tuesday, we noted that, in the short-term, wages are rising far faster than output can justify, which means that either output needs to ramp up or wages need to decelerate. Over the long-term, though, nominal wages are basically moving at a similar pace to consumer prices plus productivity. In other words, on a trend basis, workers are earning slightly more than inflation plus productivity over the past five years. This tells us that the wage growth experienced over the last five years is likely sustainable, and further wage growth over the medium-term would not be surprising.
Following Wednesday’s inflation print, we took a look at the S&P 500’s performance when CPI is decelerating versus accelerating. As you can see from the chart below, decelerating inflation leads to better market performance across the board.

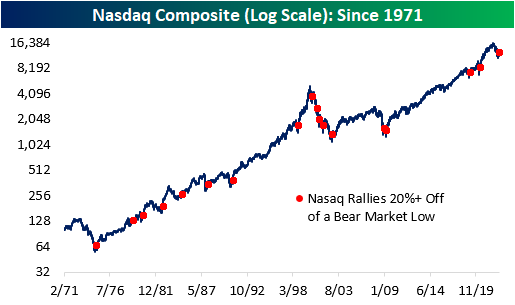
As of Wednesday, the Nasdaq Composite officially entered a new bull market based on the traditional 20%+ rally/decline threshold. All-in-all, the bear market experienced between November 19th, 2021 and June 16th was extraordinarily average, with the duration being just eight days above the average and the drawdown being 1.4 percentage points below that of the average. Let’s hope that this bull market is average as well, as this would imply gains of 135% over 841 days relative to the 6/16 low.
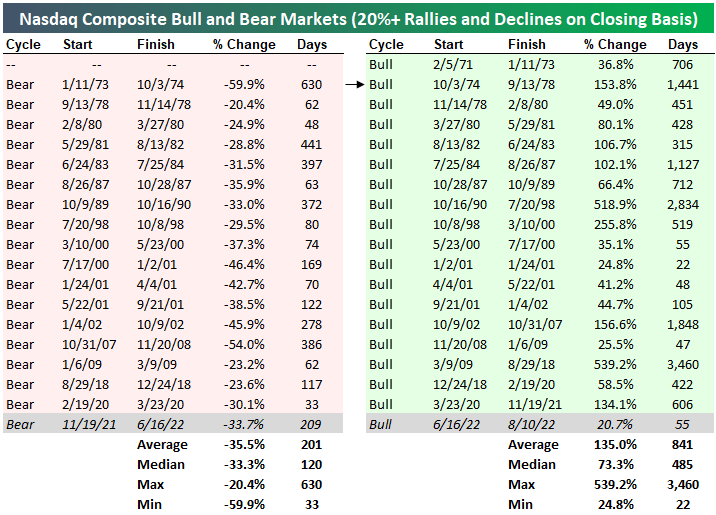
Below are all of the 20%+ rallies off of bear market lows since the Nasdaq’s inception. Apart from the dot-com era which experienced a massive bust, the forward performance has been quite positive.
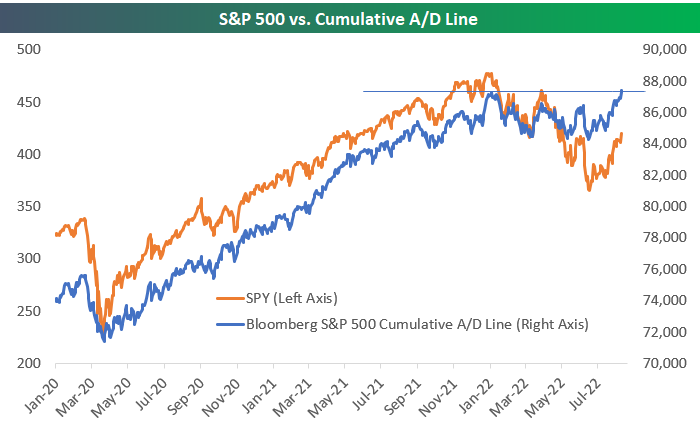
As of Thursday’s close, Bloomberg’s tracking of the S&P 500’s cumulative advance/decline line made a new all-time high. That represents significant divergence from the index’s price, which is still 12% below all-time highs. This kind of divergence is typically viewed as bullish, but you can read our B.I.G. Tips report on the topic to see if that’s really the case based on historical trends.
Americans across the country are breathing a sigh of relief as the AAA National Average price of gas per barrel broke below $4.00. Although the level is still elevated, the price of gas has been continuously declining.

This week was equally busy in the political sphere. Donald Trump’s residence was raided by the FBI, Biden signed the CHIPS Act, and the Inflation Reduction Act appears likely to be signed into law. All of this has come as we’ve seen a big shift in the betting market odds for Democrats and Republicans to take control of the Senate later this year.

If you would like to receive content like this daily, click here to start your trial today!
Aug 9, 2022
Tomorrow, the all-too-important July CPI report comes out. Although the FOMC tends to focus more weight on personal consumption expenditures (PCE) instead of CPI, this release will give investors the first official inflation read of July. Depending on how this report comes in relative to expectations will therefore give a lot of insight into the direction/intensity of policy heading into the last four months of the year. A higher print (especially given the strength in last week’s nonfarm payroll data) would a higher likelihood for continued aggressiveness in rate hikes, while a weaker than expected print could cause markets to price in a more benign path moving forward. As of today, analysts expect headline CPI to increase 8.7% y/y, which would be a 0.4% decline from June’s rate.
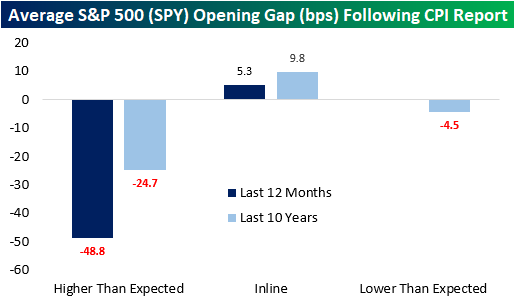
Last month, analysts expected CPI to rise 8.8% YoY, but the print came in at 9.1%. Over the last twelve months, CPI has come in hotter than expected two-thirds of the time. Notably, CPI has not come in below expectations over the last twelve months but did match expectations one-third of the time. In terms of market expectations, over the last twelve months, the S&P 500 has averaged an opening gap of -49 basis points following a CPI print that was hotter than expected. That’s about twice the average gap lower of 25 bps following all higher-than-expected prints over the last ten years. The market tends to gap higher following an inline print, averaging a gain of 5.3 bps over the last twelve months and 9.8 bps over the last ten years. Click here to learn more about Bespoke’s premium stock market research service.
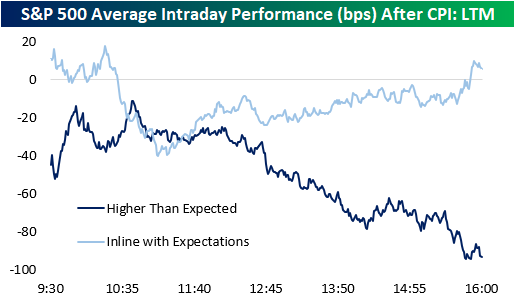
Following all CPI prints over the last twelve months, the S&P 500 has tended to gap lower but move close to the break-even level in the first half hour of trading. Following this initial bounce, the S&P 00 has tended to bounce around but remain in negative territory. The second half of the trading day has been much weaker, though, finishing the day down 60 basis points on the day.

Over the last twelve months, intraday performance has diverged based on the result of the report. When CPI matches expectations (three occurrences), the S&P 500 gaps higher but has surrendered those gains by about 10:30. However, following a bottom at about 11:00, stocks tend to pick up steam throughout the rest of the trading day. When CPI comes in hotter than expected, we see nearly the exact opposite. The S&P 500 gaps lower, but generally moves higher until about 10:45, when things take a turn weaker. The back half of the trading day has been notably weaker with stocks closing right near their lows of the day, booking an average decline of 93 basis points. Click here to learn more about Bespoke’s premium stock market research service.