Jun 29, 2022
There’s no questioning that markets have been extremely volatile this year. Yesterday, the Nasdaq 100 tracking ETF (QQQ) declined by 3.0%, which for 2022, has not been a foreign occurrence. In fact, yesterday was the eleventh time this year that QQQ fell by at least 3%. Since QQQ began trading in 1999, this will be the fifth-highest number of 3%+ daily declines in the first half of the calendar year (top chart below). Although the number of 3%+ daily declines is still well below 2020 and dot-com era levels, it is still a significantly elevated reading. In fact, this year’s first-half pace has been well ahead of levels from 2008 and 2009 and is only three shy of the pace in 2020. Click here to learn more about Bespoke’s premium stock market research service.
Volatility has not been exclusively to the downside, though. On top of the 11 3%+ declines, there have been nine days so far in 2022 in which QQQ rose by at least 3%, bringing the total number of absolute daily moves of 3%+ to 20. This too ranks fifth of all years since 1999, falling five short of 2020 and 31 short of 2000.

Of all 260 3%+ daily declines in QQQ since 1999, 143 occurred between the start of 2000 and the end of 2002 (the unwinding of the dot-com bubble). During this time, QQQ fell a whopping 74.3%! The chart below shows QQQ since 1999, with the red dots marking each 3%+ decline.

QQQ’s performance following these occurrences is heavily skewed by the dot-com era weakness. While performance over the following week has been slightly better than average versus all periods since 1999, forward returns in the following one and three months have trailed the long-term averages. Since the end of the dot-com bubble burst (2003), forward returns following these occurrences looks much more attractive with QQQ averaging a gain of 44 bps (median: 54 bps) in the week following a decline of 3%+. Over the following month, QQQ has averaged a gain of 1.4% (median: 1.6%) and over the next three months has averaged a gain of 7.3% (median: 7.2%). The positivity rates over the following week, month, and three months have been 57.6%, 58.3%, and 74.5%, respectively. Click here to learn more about Bespoke’s premium stock market research service.

Jun 28, 2022
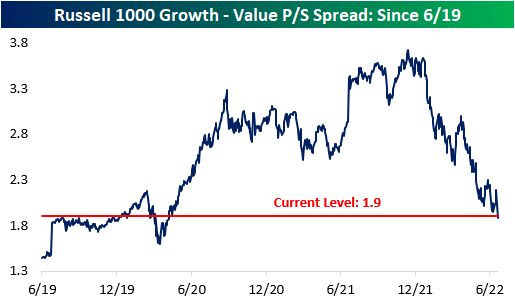
It’s no secret that there has been a massive pullback in valuation multiples, and stocks that had higher multiples have been hit much harder by the recent market pullback. This comes as rate hikes increase the discount rate and the era of “free money” comes to an end, which inherently lowers the risk appetite of investors. The chart below shows the price to sales (P/S) spread between the Russell 1000 growth index and the Russell 1000 value index. Naturally, growth stocks should always trade at higher multiples, but the spread became magnified throughout the pandemic. The spread peaked in mid-November 2021 at 3.7, but it has contracted by 1.8 points to 1.9 as of today’s open. Whereas the growth index has seen its P/S ratio decline by 36.4%, the value index has only seen a P/S decline of 13.0%. The growth index currently has a P/S ratio of 3.6, compared to 1.7 for the value index. The P/S spread between the two indices is now inline with pre-COVID levels, so the stretched growth multiples of the pandemic-era have come full circle. Click here to learn more about Bespoke’s premium stock market research service.
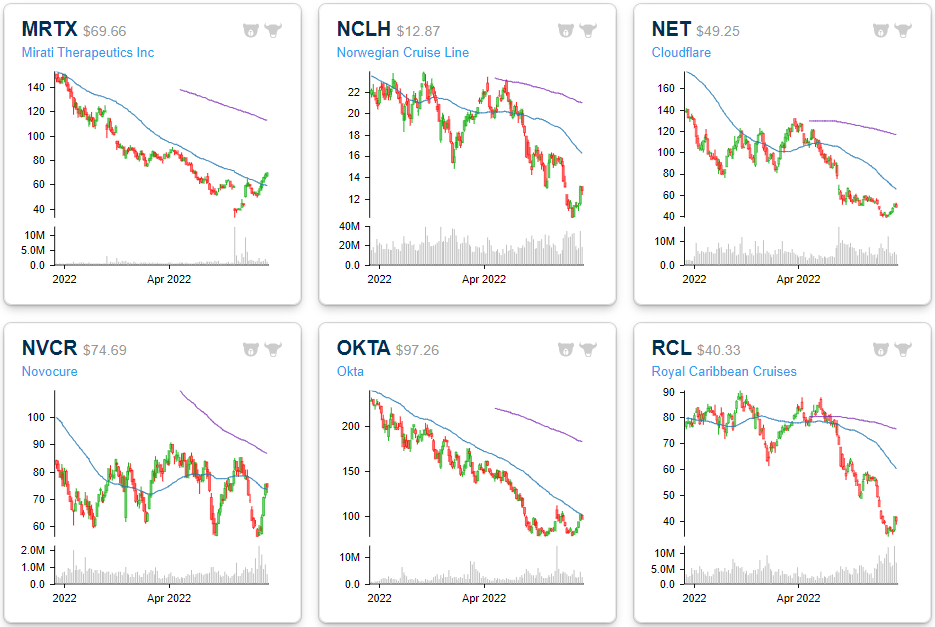
Dissecting this further, we took a look at the 20 Russell 1000 stocks that have seen their P/S multiples compress the most since their respective 52-week highs. Leading this group is Lucid (LCID), which has seen the P/S ratio decline by a whopping 275,309 points. This comes as sales increased substantially and the price declined significantly (-68.2% since the 52-week high). Even still, LCID’s P/S ratio remains in the stratosphere at 359. Next on this list is Norwegian Cruise (NCLH) and Carnival (CCL), which have experienced a similar phenomenon. Sales fell off a cliff for the cruise lines following COVID, causing their P/S ratios to spike. As sales have returned on the re-opening and share prices have continued to decline, P/S ratios have fallen significantly. The largest decliners in share price since their respective 52-week highs on this list are Upstart (UPST), DocuSign (DOCU) and Unity Software (U), which have declined by 90.4%, 79.0% and 78.9%, respectively. Upstart has seen its P/S ratio fall from 37.8 down to 3.0. The median stock on this list trades 10.8 times LTM sales, which is still aggressive to say the least. Most stocks topped out either last summer or in October/November.

The six month price charts below are available using our Chart Scanner tool. You can click here to view a custom portfolio of these twenty stocks if you’re already a subscriber. As you can see, the vast majority are in sustained downtrends. However, if interest rate pressures subside and risk appetites increase, these twenty names could benefit through multiple expansion. Click here to learn more about Bespoke’s premium stock market research service.


Jun 27, 2022
The US stock market has been weak and in a downtrend since late 2021, and there are some individual names that haven’t been able to post a positive month in quite some time. Of all S&P 1500 members, there are actually eight stocks with a market cap of at least $2 billion that are on a monthly losing streak of seven or more months. Six of these eight names are members of the Consumer Discretionary sector (the worst performing sector on a YTD basis), which is down 27.8% in 2022 (as of Friday’s close). The largest company on this list is Nike (NKE), which reports after the close today. The stock would need to gain about 7.5% through the end of the month to break its seven month losing streak. The average stock on this list would need to gain 6.7% through the close on 6/31 to break their respective streaks. Etsy (ETSY) is the closest to breaking its streak, needing to gain just 0.9%, while Under Armour (UAA) is the furthest, needing 13.7%. On a YTD basis, these stocks are down an average of 41.4% (median: -35.0%), meaning they would need to gain ~70% through year’s end to finish 2022 in the green.

Below is a quick look at one-year price charts for these eight stocks. (You can click here to create a custom portfolio of these names if you’re a Bespoke client.) Unsurprisingly, these stocks on 7+ month losing streaks are trading in pretty steep long-term downtrends, and they’ve got a lot of work to do to get back to where they were trading late last year. New uptrends can’t emerge until these long monthly losing streaks finally come to an end. Click here to learn more about Bespoke’s premium stock market research service.

Jun 23, 2022
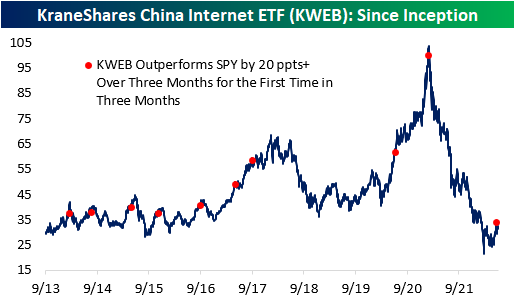
On a year to date basis, both the S&P 500 (SPY) and the KraneShares China Internet ETF (KWEB) are well in the red. However, KWEB is now outperforming SPY (-11.9% vs. -20.8%) by a considerable margin after bouncing 50% off its lows in early March. Since late May (5/24), KWEB has gained 29.7% versus a decline of 4.5% for SPY. As you can see in the first chart below, KWEB has made a few higher lows over the last few months, while SPY has continued to make lower lows.


The rolling three-month performance spread between KWEB and SPY hit an all time high of +55.8 ppts on June 10th of this year. Although the performance spread has fallen over the last few trading sessions, the outperformance is still quite notable. (It’s also worth noting that KWEB is still much further below all time highs than SPY with KWEB down 69% and SPY down 21%.)
In March of 2021, KWEB topped out and shed a considerable amount of its value. SPY didn’t follow suit until about nine months later. With KWEB rallying off of lows in recent months and actually attempting to start making higher highs, equity market bulls are hoping KWEB is leading to the upside similar to how it led to the downside.

While US markets have struggled over the last three months, Chinese equities have held up well. In this time period, the S&P 500 (SPY) has declined 16.5%, but the KraneShares China Internet ETF (KWEB) has gained 5.6%, resulting in a performance spread of 22.1 percentage points. The rolling three month performance spread peaked at 55.8 ppts on June 10th, as KWEB had gained 49.8% and SPY had dropped by 6.5% over the prior three months. This was the largest 3-month performance spread since KWEB began trading in September 2013. Throughout KWEB’s history, there have only been ten occurrences of KWEB outperforming SPY by more than 20 percentage points over three months (for the first time in three months). Although Chinese equities are still well off their highs, this recent outperformance definitely raises some eyebrows. Click here to learn more about Bespoke’s premium stock market research service.
Historically, when KWEB has outperformed SPY by 20 ppts or more over three months (for the first time in three months), the ETF has tended to deliver weak forward performance. Of the nine prior occurrences, only two resulted in positive performance over the next three months, and the average return was -7.4% (median: -7.8%). Over the next year, KWEB has tended to underperform its historical averages by 12 percentage points. Across the board, positivity rates are lower than that of all periods, which holds true for median and average performance as well. Click here to learn more about Bespoke’s premium stock market research service.

Jun 23, 2022
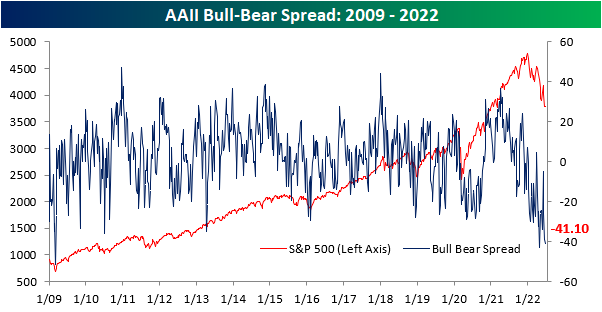
Even as the ten-year yield and crude oil have pulled back over the last few trading sessions and the S&P 500 has recuperated the losses from late last week, the percentage of respondents to the AAII survey considering themselves bullish fell for the third consecutive week. This week’s reading of 18.2% marks the lowest level since late April and ranks in the bottom 1.3% of all weeks going back to the start of the survey in 1987. On the bright side, the rate of decline in bullish sentiment has been on the decline as the percentage of respondents that considered themselves bullish fell by 11 percentage points two weeks ago, 1.6 percentage points last week, and now just 1.2 percentage points this week.

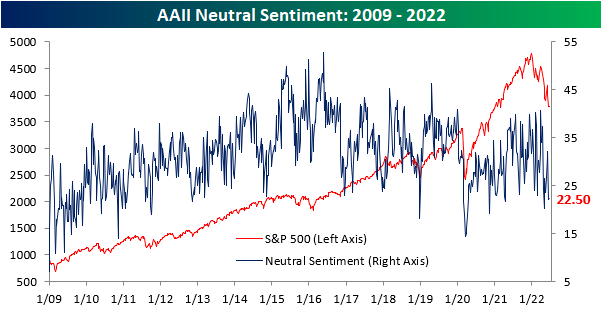
The percentage of respondents reporting neutral sentiment moved modestly higher, increasing by just 30 basis points to 22.5%. Click here to learn more about Bespoke’s premium stock market research service.
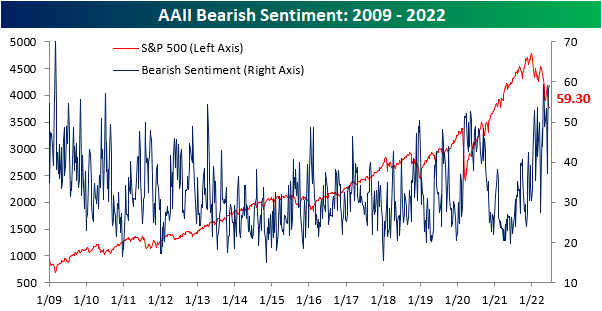
The percentage of respondents reporting bearish sentiment rose for the third consecutive week to 59.3%, the highest level since late April. The 4/28 reading was only 10 basis points higher than this week’s, so we are near the previous peak in terms of bearish sentiment. Apart from the late April reading, bearish sentiment had not topped 59% since early March of 2009. In fact, this week’s reading is in the 97th percentile of all readings since the survey began in 1987.
The bull-bear spread remains near historic lows, and there have now been 22 consecutive weeks in which the spread was below -10 (smoothed out by taking a four week moving average). We are now just four weeks away from setting a new record in this regard. The previous high was in 1991 when there were 26 consecutive weeks in which the bull-bear spread was under -10. Investors often view this as a contrarian indicator, as low readings in bullish sentiment leave upside for the market should sentiment bottom out and positive news emerge. Click here to learn more about Bespoke’s premium stock market research service.