Apr 7, 2022
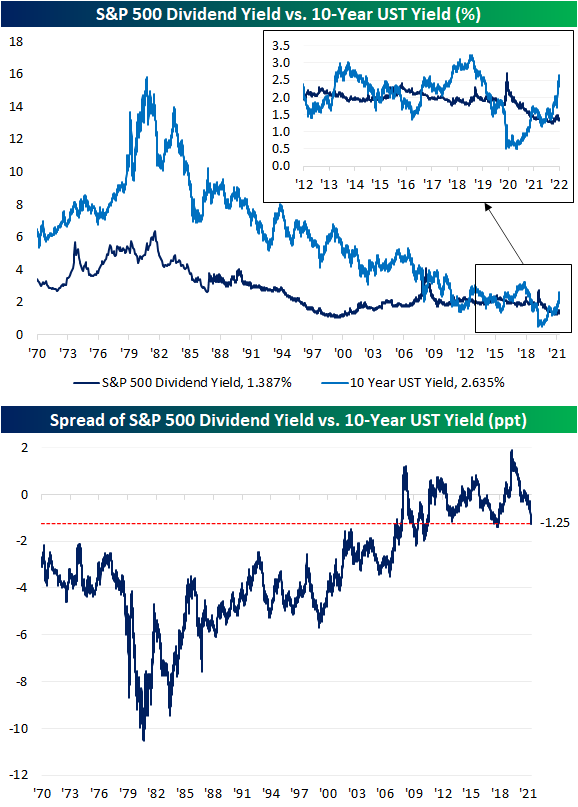
US Treasury yields have experienced a dramatic move higher as the market prices in continued rate hikes in the near future. With the increase in long-term Treasury yields, we’re starting to see what looks like the end of a period where the S&P 500 and the 10-year Treasury fought back and forth over which asset class had a more attractive yield.
As shown in the chart below, from 1970 right up to the period before the global financial crisis, the 10-year yield consistently yielded more than the S&P 500. As the Fed cut rates to zero during the crisis, though, the S&P 500 went on to see multiple periods where its dividend yield was in excess of the 10-year Treasury yield. With the recent surge in yields as the Fed embarks on what the market expects to be an aggressive rate hiking cycle, the script has been completely flipped. The 10-year now offers a roughly 125 bps higher yield than the S&P 500 dividend yield which is the widest spread since the fall of 2018 and before that, the fall of 2011. As the spread between the S&P 500 dividend yield and 10-year Treasury yield hits the low end of the GFC/post-GFC era, we would note that current levels are still roughly 200 bps higher than the historical average going back to 1970. Click here to view Bespoke’s premium membership options.
Apr 6, 2022
The S&P 500 is lower again today and dropping back below its 200-DMA as of this writing. After rallying over 11% in the second half of March, the S&P 500’s current leg lower has brought it down roughly 3.4% from the March 29th closing high. As for which stocks have done the best and worst during the recent leg lower, it has more or less been a story of rotation from earlier this year. To get a gauge on this, in the charts below, we took a look at the performance of S&P 500 stocks since the recent peak in late March based on their performance during the two legs lower (1/3 through 1/27 and 2/9 through 3/8) as well as during the two rebounds off those lows (1/27 through 2/9 and 3/8 through 3/29).
We go through the charts in a little more detail below, but the short of it is that since the recent high in the final days of March, the worst performing stocks have been the same names that were the weakest during the prior two legs lower this year. Conversely, the stocks that have outperformed recently have been the same ones that were the worst performers during the two rallies in late January/early February and during March. Click here to view Bespoke’s premium membership options.
The two charts below show the performance of S&P 500 stocks since 3/29 grouped into deciles based on how they performed during selloffs from 1/3 to 1/27 (top chart) and from 2/9 to 3/8 (bottom chart). In the case of both charts, the general trend has been that stocks that performed the worst during each of the prior sell-off this year have also been the worst performers over the last week or so since the close on 3/29, while the stocks holding up the best are the same ones that outperformed during those declines.

Similar to the analysis above, the two charts below show the performance of S&P 500 stocks since 3/29 grouped into deciles based on how they performed in the rallies from 1/27 to 2/9 (top chart) and from 3/8 to 3/29 (bottom chart). In this case, the general trend has been that stocks that performed the best during each of the rallies this year have been the worst performers since the close on 3/29, while the stocks that underperformed the most in the two rallies have sold off the least during this most recent decline.

Mar 31, 2022
The last couple weeks of the first quarter have seen equities reverse a sizable portion of this year’s losses and sentiment has rebounded in sync, though, bullish sentiment turned slightly lower this week in spite of the S&P 500’s move higher. From the weekly AAII sentiment survey, bullish sentiment shed 0.9 percentage points coming in at 31.9%. Even after that decline, the current level of reported optimism remains above all others (outside of last week) since early January, but bullish sentiment still would need to rise another 6 percentage points to move back up to its historical average.

While more investors are not reporting much optimism, fewer are outright bearish. Bearish sentiment fell for a second week in a row falling another 7.9 percentage points to 27.5%. With a little over a quarter of respondents reporting as bearish, this sentiment reading is at the lowest level since November. That is also now the biggest two-week decline in bearish sentiment (22.3 percentage points) since November 2009 when it had fallen 23.74 percentage points in a two-week span.

Finally, we would note that given bearish sentiment has plummeted at a historic rate without much of an increase in bullish sentiment, neutral sentiment has picked up the difference. That reading clipped above 40% this week for the highest level since January 2020.
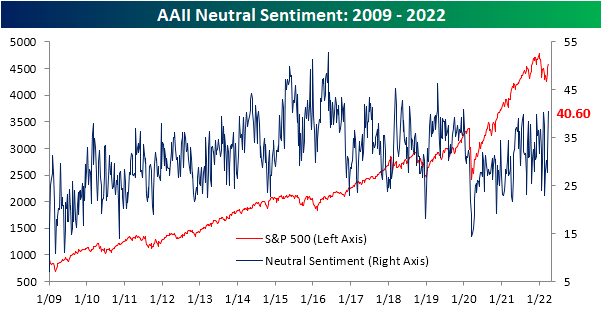
Other sentiment surveys like the Investors Intelligence one and NAAIM’s Exposure Index have also pivoted more bullish this week. As a result, our sentiment composite is close to zero meaning across these three indicators, sentiment is now only just slightly below the historical average. Click here to view Bespoke’s premium membership options.

Mar 25, 2022
The CBOE Volatility Index (VIX) was invented to allow investors to speculate about volatility over the next 30 days. The VIX is commonly referred to as the fear index, and readings above 20 tend to occur in uncertain times filled with concern, while readings below 20 indicate a perceived relatively low-risk environment. As of late, the average intraday range of the S&P 500 has been quite high, with the last 30 trading days averaging a trading range of 2%, which is on the high side relative to history. In fact, the 30-day rolling average percentage spread between intraday highs and lows did not cross 2% throughout the entirety of 2021, but on the first day of February 2022, we broke a 440 trading day streak in which the reading was below 2% that had bene in place since the days coming out of the COVID crash.

As depicted below, the VIX tends to spike during times in which market volatility increases. However, the current elevated level of intraday volatility has not been matched with a proportional rise in the VIX. Based on historical data, the VIX should currently be closer to 26.5, but the current reading of 21.8 is 17.6% below the implied value we would derive from the last 30 days of intraday volatility alone. This suggests that although the market has been shaky as of late, investors expect an easing of that volatility in the near future. Click here to view Bespoke’s premium membership options.
