May 10, 2022
In 2020 and most of 2021, dividend stocks underperformed the broader S&P 500 as investors put an emphasis on growth due largely to the low-rate environment. Since the Fed pivot to a tightening bias beginning in late 2021, though, there has been a sharp reversal in this trend.
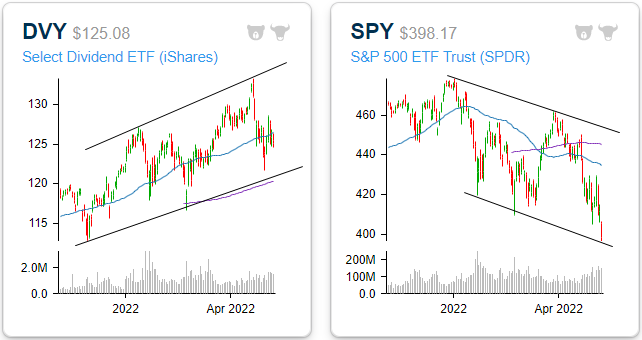
As it currently stands, the iShares Select Dividend ETF (DVY) has made up just about all of its pandemic-era underperformance versus the S&P 500 (SPY). Since the pre-pandemic highs, DVY has gained 16.9% versus a 17.9% advance for SPY, and that doesn’t even include the impact of dividends. After taking into account DVY’s higher yield (3.0 vs 1.6%), it is actually outperforming SPY during this span. Looking more closely at just 2021, DVY has outperformed SPY by 17.7 percentage points (+1.3% vs -16.3%) as investors have exited growth and into more value and income-oriented investments.

Whereas all of the major indices have entered downtrends, DVY is yet to break its uptrend. The ETF is trading well above its 200-DMA but slightly below the 50-DMA. Overall, the technical picture is relatively attractive, especially in comparison to the broader market. The following graphs are accessible through our Chart Scanner tool. Gain access to our proprietary tools by clicking here to view Bespoke’s premium membership options.
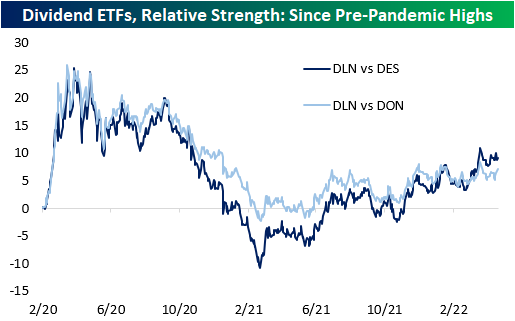
Within the high-dividend space, large caps have outperformed both mid and small caps. The WisdomTree US Large Cap Dividend ETF (DLN), the WisdomTree US Mid Cap Dividend ETF (DON), and the WisdomTree US Small Cap Dividend ETF (DES) were the funds used to compare performance across market caps. As you can see from the chart below, the larger companies that pay hefty dividends have outperformed mid-caps, and mid-caps have outperformed small caps. All three ETFs have similar yields, so the market cap discrepancies are likely more market-related.
While the average S&P 500 stock is down 11.8% on a year-to-date total return basis (median: -14.7%), the 25 highest dividend-paying stocks excluding energy (shown below) are down an average of 8.6% (median: -11.8%). Although this performance is not stellar, the average is still 320 basis points above that of the broader index. Given the recent surge in energy prices over the last year, a number of stocks in the Energy sector have seen their dividend payouts surge. Given the volatile nature of energy prices, the level of these yields may not be sustainable, so for that reason, we have left them out of this specific list.

Apr 18, 2022
See what’s driving market performance around the world in today’s Morning Lineup. Bespoke’s Morning Lineup is the best way to start your trading day. Read it now by starting a two-week trial to Bespoke Premium. CLICK HERE to learn more and start your trial.
Bespoke’s Quote of the Day: “The difference between death and taxes is death doesn’t get worse every time Congress meets.” – Will Rogers

Below is a snippet of content from today’s Morning Lineup for Bespoke Premium members. Start a two-week trial to Bespoke Premium now to access the full report.
Below is a table we highlight each year showing the S&P 500’s performance in the weeks leading up to and the weeks immediately following Tax Day. As shown, over the last 20+ years, the weeks before Tax Day have been much weaker for the market than the weeks after. This year has been no different thus far with the S&P falling more than 3% in the two weeks leading up to Tax Day. Now we just need the trend of gains in the two weeks following Tax Day to hold as well!

Start a two-week trial to Bespoke Premium to read today’s full Morning Lineup.
Apr 11, 2022
The S&P 500 has fallen in four of the past five sessions continuing to pull back from its lower high, but surprisingly, the net percentage of the index hitting new 52-week highs actually saw one of the strongest readings of the year on Friday as we show in the chart from our Sector Snapshot below. To cap off last week, a net 11% of S&P 500 stocks were at new 52-week highs; the highest reading since January 5th which was only a couple of days after the index’s last all-time high. Typically, we look at net new highs as a way to confirm moves in the broader market. In other words, it is viewed as better to see a larger number of stocks trading at new highs versus new lows. While net new highs are so far lower today, Fridays’ double-digit positive reading was unusually high for a down day. Historically going back to 1990, the average net new high reading when the S&P 500 has been lower on the day has only been 1.6%. It was even a strong reading compared to the average for up days (4.77%) as well.

As for how new highs have held up relatively well as the broader market has pulled back, defensive sectors—Consumer Staples, Health Care, Utilities, and Real Estate—are almost entirely the ones to thank. To illustrate this, below we show the daily percentage of S&P 500 stocks hitting new highs that are from one of the four defensive sectors just mentioned. There is plenty of precedent in the past several years for these four sectors to account for all of a day’s new highs including several days in late January and early February. At the high last Wednesday, over 90% of S&P 500’s new highs came from defensive sectors. On a 50-DMA basis, this reading is now at the highest level since the spring of 2020.

In other words, defensives have been a notable pocket of strength recently. As for just how large of a run they have been on, in the charts below we show the rolling one month change of these sectors going back to 1990 (2001 for Real Estate). While the rates of change have peaked, Health Care and Utilities are up double digits in the past month while Consumer Staples and Real Estate have risen high single-digit percentage points. For all sectors except for Real Estate, those rallies rank in the top 3% of all monthly moves since 1990 and Real Estates is still in the top decile of all monthly moves going back to 2001. Click here to view Bespoke’s premium membership options.

Apr 11, 2022
It seems like just yesterday that the streaming market was dominated by a single player: Netflix (NFLX). This dramatically changed when new entrants such as Amazon (AMZN), Paramount (PARA), Comcast (CMCSA), Hulu, and YouTube (GOOGL) helped create a relatively fragmented and competitive market. The conjunction of all of these platforms and a shift in consumer preferences has put pressure on legacy television brands and forced conversion into streaming. Three years ago today, Disney (DIS) announced that their streaming platform, Disney +, would be unveiled just seven months later.
When DIS first announced the launch of its streaming platform, investor excitement was clear, as the stock soared 11.5% the following day, the largest single day upside move since May of 2009. DIS has the ability to source content from its existing brands, such as Lucasfilm, Marvel, ABC, The History Channel, Pixar, 20th Century Studios, A+E Networks, and more. Its unique setup allows the company to produce content from profit generating-entities, and further monetize said content by offering it to consumers on its streaming platform. DIS also owns ESPN and Hulu, which increases the attractiveness of the collective platform as a family package, covering everything from live sports to children’s programming. At the end of fiscal year 2021, Disney+ had 33,000 episodes and 1,850 movies on the platform, bringing the title total to about 35,000. On the other hand, Netflix had 50,000 titles in March of 2020, so DIS is slightly behind in aggregate content relative to the largest competitor in the sector. Since the start of 2020, the number of users on the Disney+ platform has grown at a compounded annual growth rate of 111.1%, growing from 26.5 million in Q1 2020 to 118.1 million in Q4 2021. The most recent quarter (Q4 2021) saw the slowest q/q subscriber growth in both percentage and nominal terms, as the service added just 2.1 million users (+1.8%).

Alongside the subscriber spike has, of course, come a spike in direct-to-consumer revenues realized by DIS. In fiscal year 2021, DIS booked $16.3 billion in revenue from its DTC segment, which was an increase of 54.7% y/y. In fiscal year 2020, DIS recognized a 38.0% increase in subscription revenues. Clearly, this channel has been growing significantly, and the pandemic helped to only propel further. Although this aspect of the business was strong in the midst of the pandemic, losses from cruises, hotels, and resorts hampered earnings results, which resulted in poor equity performance for DIS. Since the start of 2020, DIS has traded down by 10.6%, even as the headwind of COVID restrictions has eased, travel has picked up, and the DTC channel has experienced immense growth.

The relative strength of Disney’s stock has been even bleaker. Since announcing the launch of Disney+, DIS has underperformed the S&P 500 by a wide margin, and the relative strength reading is currently sitting at the lowest level since 2012. In its Q4 2021 earnings report, DIS reported slowing subscriber growth, which caused the relative strength to weaken even further. Moving forward, investors will be keenly aware of the performance of Disney+ as well as the performance of the parks, resorts, and cruises as pent-up travel demand continues to come into the market. Although the launch of Disney+ has gone relatively well, the platform has room to run in terms of penetration, subscriber counts, and international expansion. The stock has not moved in conjunction with subscriber growth as questions over revenues generated per user, a highly competitive streaming space, and the company’s exposure to still-suppressed industries still cloud the outlook. Click here to try out Bespoke’s premium research service.

Apr 7, 2022
After peaking at 32.8% two weeks ago, bullish sentiment continues to roll over as the S&P 500 has erased some of the March gains this week. After this week’s decline of 7.2 percentage points in bullish sentiment, less than a quarter of respondents reported as bullish. While low, that is still a few percentage points above the weaker levels from February.

Bearish sentiment in turn rose 13.9 percentage points which was the biggest one-week uptick since August 2019 when it rose 24.14 percentage points. At 41.4%, bearish sentiment is now at the highest level since the week of March 17th. That is an elevated reading and a big move week over week, but it is also well off recent highs from the past few months that were more than 10 percentage points higher.

The bull-bear spread tipped into positive territory for the first time in 2022 last week, but the big inverse moves between bulls and bears erased much of the past few weeks’ move. The spread is down to -16.7 which is still 13.6 points above the late February low of -30.3.

The big pickup in the number of respondents reporting as bearish didn’t entirely come from the bullish camp. Neutral sentiment also shed a significant amount falling from 40.6% last week to 33.9%. That is essentially mean reversion as neutral sentiment now sits only a couple of points above the historical average. Click here to view Bespoke’s premium membership options.
