Jun 30, 2022
As we noted in today’s Chart of the Day, inflation data has been moderating and so too have gas prices as demand has pulled back and refinery output rises as we discussed in last night’s Closer. Roughly two weeks ago, AAA’s national average price for a gallon of regular gasoline peaked just above $5. Granted it is still elevated, but that price has fallen to $4.86 today. Taking one step further up the supply chain, Gasoline futures peaked even further ago on June 9th and have fallen 14.5% since then. As shown in the second chart below, that decline is now putting the past several month’s uptrend on the ropes.

While both the national average and gasoline futures have been rolling over, the decline in the latter has been far larger as those prices tend to slightly lead retail prices. As for the size of that disconnect, taking the spread of the one-month percent change of the two measures of gasoline is historically wide at 14.4 percentage points. The last times such a divergence has been observed were earlier this spring, last fall, and back in 2020. In those periods, such divergences were short-lived. As shown in the bottom chart where we overall the AAA national average and Front Month Gasoline futures, moves in the futures market tend to lead prices at the pump, in other words, it is unlikely retail prices will continue to fly in the face of lower futures prices. Click here to learn more about Bespoke’s premium stock market research service.


Jun 30, 2022
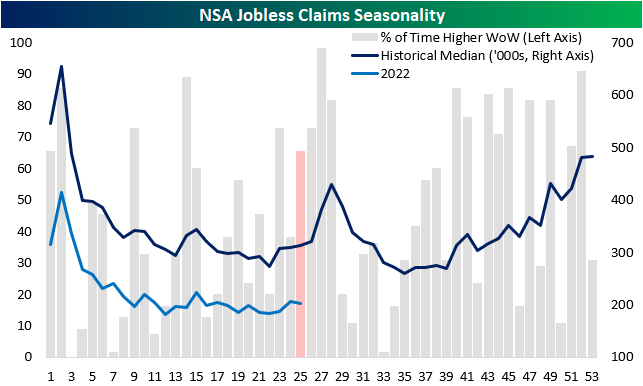
Seasonally adjusted initial jobless claims came in at 231K which was ever so slightly above expectations of 230K. Meanwhile, last week’s number brought up the low end of the recent range after a 4K upward revision to 233K. That means the most recent read actually showed an improvement versus the previous week whereas before it would have been a modest deterioration in the number. Regardless, claims remain well off of the multi-decade lows from earlier in the spring, but even at current levels, the only historical periods with parallels for as strong of a level were just before the pandemic and the late 1960s to early 1970s.

We would also note that even though claims are up versus the early spring, the reading has seen very little movement in the past month. Quantifying this, the four-week rolling standard deviation in claims has fallen below 1 for only the seventh time on record going back to 1967. The past six times this happened were: April 1988, March 1990, September 2006, August 2016, and June 2019. That is not to say that claims are either improving or deteriorating in any sort of significant way, but rather claims have been remarkably stable in recent weeks.

On a non-seasonally adjusted basis, claims have likewise been little changed over the past few weeks having gone from 206.1K two weeks ago, to 206.4K last week to 207.4K this week. Without much movement, this week’s reading on claims continues to show a stronger reading than comparable weeks pre-pandemic even if they have come off of recent lows from earlier this year.
When taking seasonality into account, as shown in the second chart below, that lack of movement in the claims number is not exactly unwarranted for the current period of the year, but it is likely to change as the next few weeks have consistently seen claims experience a brief and sizable uptick.

Turning over to continuing claims, the rise off of pandemic and multi-decade lows has been much less severe. In the most recent week’s data through June 17th, continuing claims fell from 1.331 million to 1.328 million. Click here to learn more about Bespoke’s premium stock market research service.

Jun 23, 2022
Jobless claims have been trending higher off of multi-decade lows, indicating a moderating labor market. This week, initial claims would have gone unchanged week over week at 229K if it were not for a modest upward revision to 231K to last week’s number. Claims did not change much on a week-over-week basis and remain modestly above the levels that were in place in the months before the pandemic. While it has been more than three months since initial jobless claims made a post-pandemic low, the rate of increase of those lows has been somewhat modest. Click here to learn more about Bespoke’s premium stock market research service.

On a non-seasonally adjusted basis, claims moved moderately lower after topping 200K for the first time since late April last week, and at a level of 203K, this week’s figure is the lowest in the last twenty years relative to comparable weeks.

Continuing claims lag by one week relative to initial claims and moved higher for the third consecutive week, representing the longest streak of weekly increases since March 2020. However, the magnitude of the rise was quite small. In fact, at the current level of 1.315 million continuing claims are still 2.1% below the level they were at a month ago. Click here to learn more about Bespoke’s premium stock market research service.

Jun 16, 2022
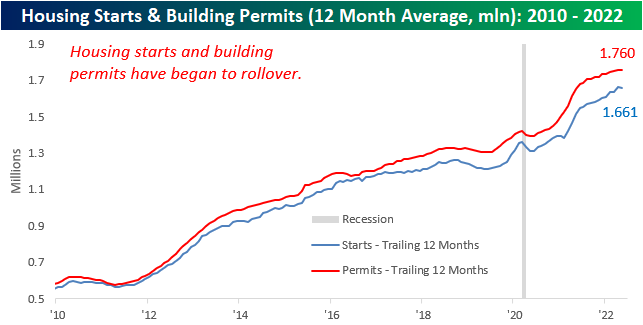
Earlier this week, we highlighted the fact that mortgage activity had fallen off a cliff due to a historic rise in rates. This is an important factor to keep in mind as the housing market tends to be a strong leading indicator for recessions, as every recession besides the COVID crash since the early 1960s has been preceded by a pronounced decline in Housing Starts. Although the NAHB index has already rolled over substantially, Housing Starts and Building Permits are yet to drop on a trailing twelve-month basis. However, the data has been showing signs of weakness, as we have now seen two consecutive months of declines in permits and a significant month-over-month fall in starts.
The table below breaks down this month’s report by type of unit and region and shows both the month-over-month and year-over-year changes. Contrary to what we saw last month, Housing Starts moved higher in the Northeast and Midwest on a m/m basis, while the South and West saw dramatic declines. On a y/y basis, only the Northeast (smallest of the four regions) saw starts move higher. In aggregate, Housing Starts fell by 14.4% month over month and 3.5% year over year. Although multi-units fell more than single units, the decline was substantial for both. In terms of permits, there was no positivity in sight, as every region saw m/m declines. This is not a positive sign for future starts data, as permits must be issued before starts can occur. In aggregate, Building Permits fell by 7.0% month over month, driven by a massive decline in the Northeast.

For the first time since February of 2021, the 12-month average of Housing Starts declined on a m/m basis. A rollover in this figure tends to be a strong recession indicator, which based on prior history would suggest that the economy is not yet in a recession. If this data continues to weaken, though. recession alarms will start ringing.

The charts below show the rolling 12-month average for Housing Starts and Building Permits since 2010 on both an overall basis (top chart) and for single-family units specifically (bottom chart). Overall, the 12-month average for headline starts and permits has experienced headwinds as of late with the rate of increase for both slowing down and starts actually showing a slight decline. The trend for single-family units, however, is much more divergent as permits have already started to roll over after peaking last summer while single-family starts have essentially leveled off during that same span. . Click here to become a Bespoke premium member today!

Jun 14, 2022
See what’s driving market performance around the world in today’s Morning Lineup. Bespoke’s Morning Lineup is the best way to start your trading day. Read it now by starting a two-week trial to Bespoke Premium. CLICK HERE to learn more and start your trial.
“He says we’re going the wrong way.”
“Oh, he’s drunk. How would he know where we’re going.” – Planes, Trains & Automobiles

Below is a snippet of content from today’s Morning Lineup for Bespoke Premium members. Start a two-week trial to Bespoke Premium now to access the full report.
After four days of basically getting their faces beat inside out, bulls are trying to make a comeback this morning aided in part by a PPI report that wasn’t stronger than expected. Small business sentiment also managed to come in slightly better than expected, although it remains weak. One item covered in today’s Morning Lineup commentary is the fact that inflation expectations in the latest ZEW survey didn’t show a pickup in inflation expectations for the US or Eurozone.
In today’s Morning Lineup, there’s a lot covered as we discuss trading in APAC and European markets (pg 4), whether or not the Fed will go 50 or 75 bps tomorrow (pg 5), overnight economic data in Asia and Europe (pg 6), and much more.
Over the last two years or so, the market has come full circle. In February and March of 2020, there was that five-week period where the only direction the market would move was lower. Shortly after, the Federal Government and Federal Reserve unleashed massive amounts of stimulus, and the market started to turn around. By early 2021, the market had completed a complete 180, and the only direction it could move was higher. Then, late last year as government stimulus started to dry up and the Federal Reserve started to get religion on inflation, cracks in the market started to emerge. By early this year, we were calling it a one-step forward and two-step backward market where every positive day was offset by at least two bad days taking the market to progressively lower levels in the process.
As painful as the one-step forward and two-step backward market felt, at least there were some positive days. Over the last few days, it has become a one-directional market, and the direction has been extreme in the wrong way. Over the last four trading days, the net advance/decline (A/D) reading for the S&P 500 has been negative 400 or lower meaning that in each of the last four trading days there have been 400 more stocks that traded lower on the day than higher. To give you some perspective on how extreme this type of streak is, since 1990, there have been ten years where for the entire 12 months there weren’t even four days where the net A/D reading for the S&P 500 was at negative 400 or lower. As shown in the chart below, there has never been a streak of similar duration, and the only time there were even three consecutive days of -400 readings was in August 2015 at the height of concerns over the Chinese yuan devaluation.

Start a two-week trial to Bespoke Premium to read today’s full Morning Lineup.