Aug 15, 2022
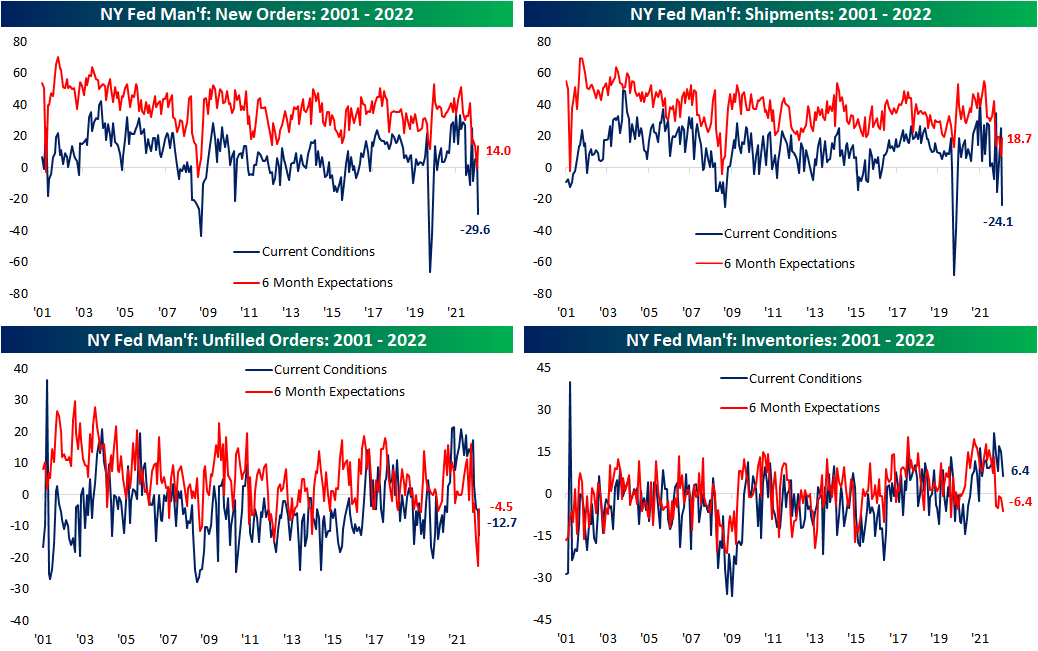
The first regional Fed manufacturing reading for the month of August which came from the NY Fed showed a massive slowdown in general business conditions. The headline number was expected to fall but remain positive at 5. Instead, the index plummeted all the way down to a contractionary reading of -31.3. That is the fourth lowest reading on record, the lowest reading since May 2020, and the largest one-month decline since April 2020. In other words, New York area manufacturers reported rapid deterioration in business conditions in the first half of August.

Breadth was equally horrendous. The sole index that managed to move higher month over month was Prices Received while declines in all of the others resulted in all but four categories falling into contraction territory. Future expectations are only slightly more positive than current conditions, albeit these too are seeing readings in the bottom few percentiles of their historical ranges even after significant moves to the upside month over month.

The most pronounced drop of any category was New Orders and Shipments with month-over-month declines of 35.8 points and 49.4 points, respectively. For both, that was the largest month-over-month drop on record with both indices now in the bottom 1% of all readings as a result. Unfilled Orders fell deeper into contraction with a less dramatic 7.5 point decline month over month.
Expectations were the inverse of that story. New Orders, Shipments, and Unfilled Orders all saw upper decile monthly increases with Unfilled Orders’ 18.1 point rise the second largest on record behind May 2010.
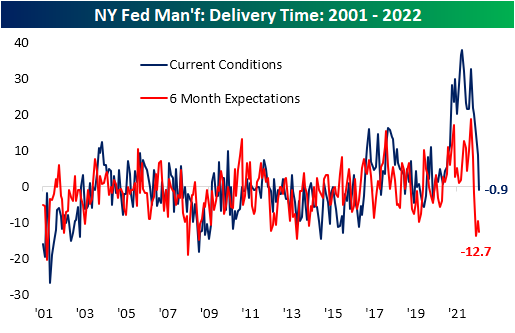
The past couple of months have seen plenty of evidence that supply chain stress has begun to ease, and this month’s report from the NY Fed added yet another data point of evidence. For the first time since May 2020, the Delivery Times index fell into contraction meaning responding firms reported a decline in how long it took for products to reach their destinations. That trend is also expected to continue as six-month expectations continue to hover around the low end of the historical range.
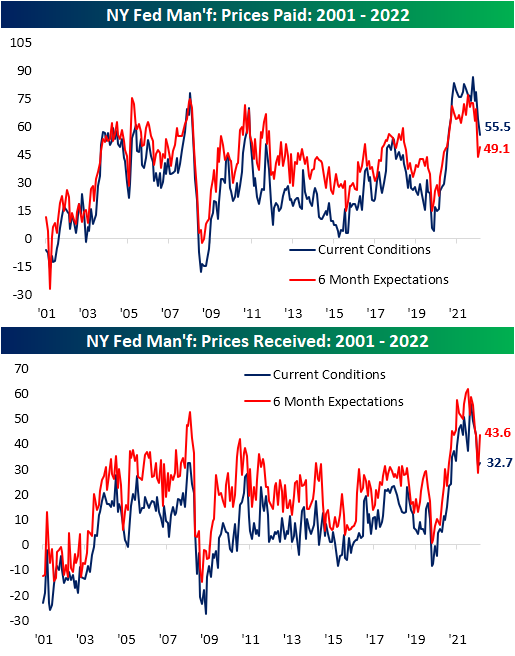
Alongside supply chain pressures, inflation pressures have likewise shown signs of easing. The Prices Paid and Prices Received index have both peaked and come in well off of prior highs of the past year indicating fewer firms are paying suppliers more or raising their prices.
Across manufacturing reports of late, employment metrics have been somewhat of a bright spot as they have managed to hold up in spite of signs of slowing demand. In August, employment did not stand out as strongly. On net, firms continue to increase their number of employees but at the slowest rate since October 2020. Meanwhile, the Average Workweek contracted to an extent not seen since the first few months of the pandemic, late 2015, during the Financial Crisis, or in the aftermath of 9/11. Meanwhile, companies are beginning to pull back on capital spending at a rapid rate as indices tracking plans for Technology Spending and Capital Expenditure have fallen sharply. For the latter, the two-month decline is now the fifth worst of any period on record. Click here to learn more about Bespoke’s premium stock market research service.

Aug 12, 2022
After another busy week for the markets, we wanted to highlight some of our favorite charts that we published for paying subscribers. Enjoy! Click here to start a two-week trial to Bespoke Premium and receive our paid content in real time.
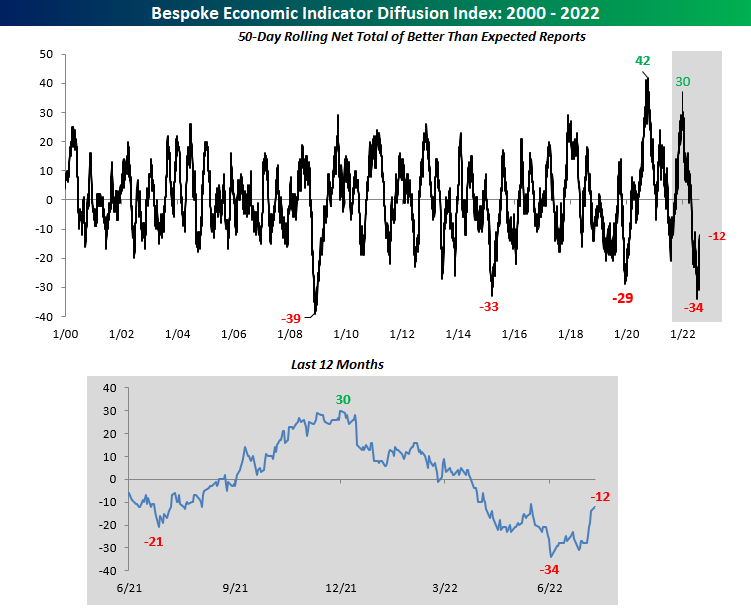
We started off the week by looking at our economic indicator diffusion index, which measures the pace at which economic indicators are coming in ahead (or below) consensus economist estimates over a 50-day period. In late June, this index hit a low that had not been seen since the great financial crisis, but it’s now 22 points above this level. It seems as if economists are struggling to predict economic data points, as the index has seen extremes in both directions since the onslaught of the pandemic.
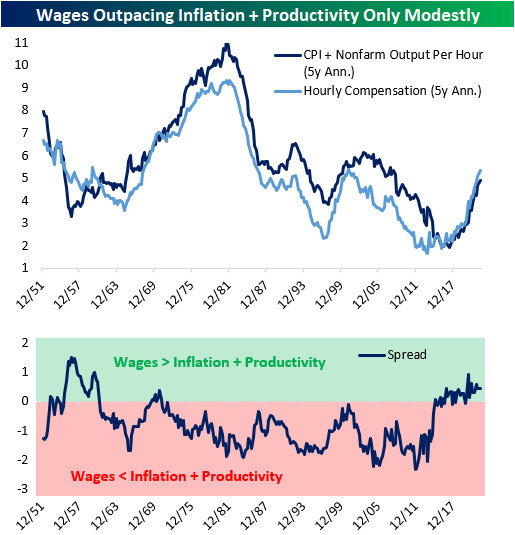
On Tuesday, we noted that, in the short-term, wages are rising far faster than output can justify, which means that either output needs to ramp up or wages need to decelerate. Over the long-term, though, nominal wages are basically moving at a similar pace to consumer prices plus productivity. In other words, on a trend basis, workers are earning slightly more than inflation plus productivity over the past five years. This tells us that the wage growth experienced over the last five years is likely sustainable, and further wage growth over the medium-term would not be surprising.
Following Wednesday’s inflation print, we took a look at the S&P 500’s performance when CPI is decelerating versus accelerating. As you can see from the chart below, decelerating inflation leads to better market performance across the board.

As of Wednesday, the Nasdaq Composite officially entered a new bull market based on the traditional 20%+ rally/decline threshold. All-in-all, the bear market experienced between November 19th, 2021 and June 16th was extraordinarily average, with the duration being just eight days above the average and the drawdown being 1.4 percentage points below that of the average. Let’s hope that this bull market is average as well, as this would imply gains of 135% over 841 days relative to the 6/16 low.
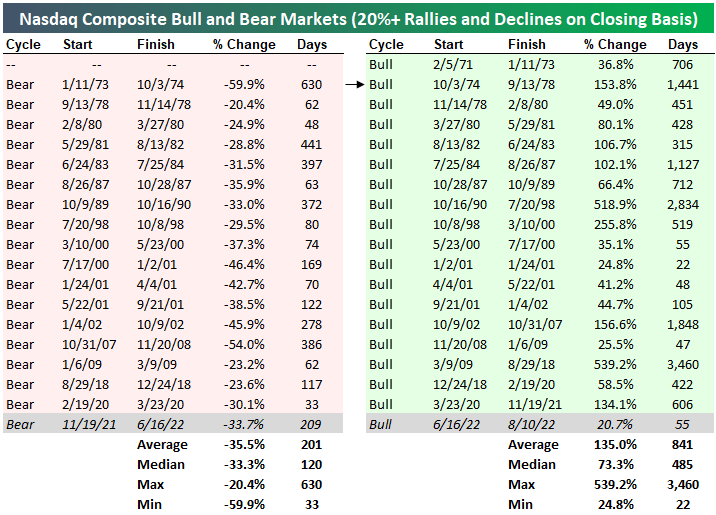
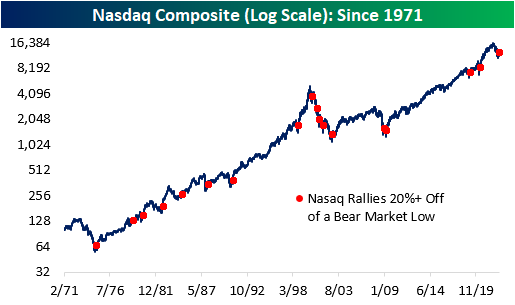
Below are all of the 20%+ rallies off of bear market lows since the Nasdaq’s inception. Apart from the dot-com era which experienced a massive bust, the forward performance has been quite positive.
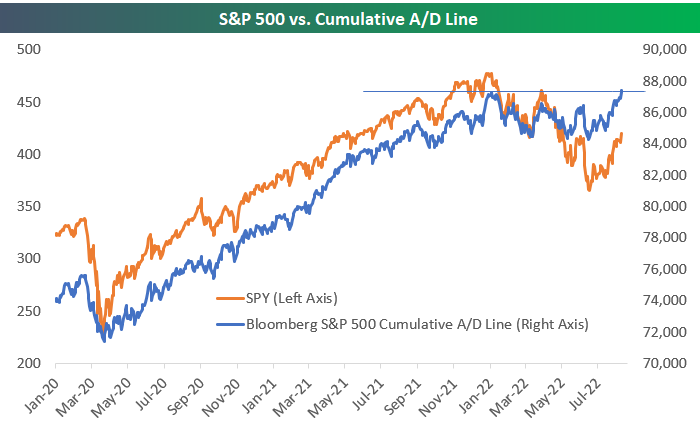
As of Thursday’s close, Bloomberg’s tracking of the S&P 500’s cumulative advance/decline line made a new all-time high. That represents significant divergence from the index’s price, which is still 12% below all-time highs. This kind of divergence is typically viewed as bullish, but you can read our B.I.G. Tips report on the topic to see if that’s really the case based on historical trends.
Americans across the country are breathing a sigh of relief as the AAA National Average price of gas per barrel broke below $4.00. Although the level is still elevated, the price of gas has been continuously declining.

This week was equally busy in the political sphere. Donald Trump’s residence was raided by the FBI, Biden signed the CHIPS Act, and the Inflation Reduction Act appears likely to be signed into law. All of this has come as we’ve seen a big shift in the betting market odds for Democrats and Republicans to take control of the Senate later this year.

If you would like to receive content like this daily, click here to start your trial today!
Aug 9, 2022
Tomorrow, the all-too-important July CPI report comes out. Although the FOMC tends to focus more weight on personal consumption expenditures (PCE) instead of CPI, this release will give investors the first official inflation read of July. Depending on how this report comes in relative to expectations will therefore give a lot of insight into the direction/intensity of policy heading into the last four months of the year. A higher print (especially given the strength in last week’s nonfarm payroll data) would a higher likelihood for continued aggressiveness in rate hikes, while a weaker than expected print could cause markets to price in a more benign path moving forward. As of today, analysts expect headline CPI to increase 8.7% y/y, which would be a 0.4% decline from June’s rate.
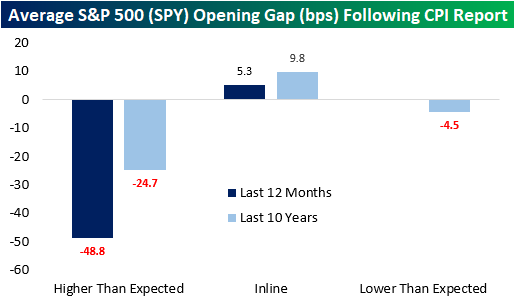
Last month, analysts expected CPI to rise 8.8% YoY, but the print came in at 9.1%. Over the last twelve months, CPI has come in hotter than expected two-thirds of the time. Notably, CPI has not come in below expectations over the last twelve months but did match expectations one-third of the time. In terms of market expectations, over the last twelve months, the S&P 500 has averaged an opening gap of -49 basis points following a CPI print that was hotter than expected. That’s about twice the average gap lower of 25 bps following all higher-than-expected prints over the last ten years. The market tends to gap higher following an inline print, averaging a gain of 5.3 bps over the last twelve months and 9.8 bps over the last ten years. Click here to learn more about Bespoke’s premium stock market research service.
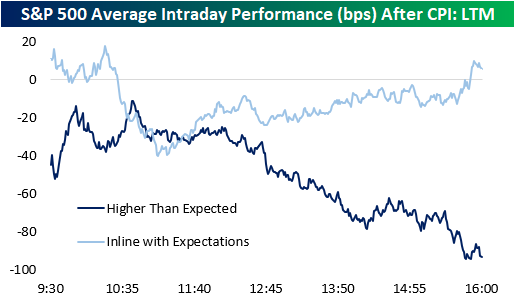
Following all CPI prints over the last twelve months, the S&P 500 has tended to gap lower but move close to the break-even level in the first half hour of trading. Following this initial bounce, the S&P 00 has tended to bounce around but remain in negative territory. The second half of the trading day has been much weaker, though, finishing the day down 60 basis points on the day.

Over the last twelve months, intraday performance has diverged based on the result of the report. When CPI matches expectations (three occurrences), the S&P 500 gaps higher but has surrendered those gains by about 10:30. However, following a bottom at about 11:00, stocks tend to pick up steam throughout the rest of the trading day. When CPI comes in hotter than expected, we see nearly the exact opposite. The S&P 500 gaps lower, but generally moves higher until about 10:45, when things take a turn weaker. The back half of the trading day has been notably weaker with stocks closing right near their lows of the day, booking an average decline of 93 basis points. Click here to learn more about Bespoke’s premium stock market research service.
Jul 25, 2022
See what’s driving market performance around the world in today’s Morning Lineup. Bespoke’s Morning Lineup is the best way to start your trading day. Read it now by starting a two-week trial to Bespoke Premium. CLICK HERE to learn more and start your trial.
“It’s a recession when your neighbor loses his job; it’s a depression when you lose yours.” – Harry Truman

Below is a snippet of content from today’s Morning Lineup for Bespoke Premium members. Start a two-week trial to Bespoke Premium now to access the full report.
The weather has been hot across much of the country the last several days, and that heat will move to the markets this week with a busy schedule of economic data, peak earnings season, and the FOMC announcing its latest policy decision.
Ahead of the kickoff of trading, equity futures and bond yields are modestly higher along with crude oil and copper. On the downside, Bitcoin is down over 3% while gold is flat. Over in Europe, Germany’s ifo index tracking the business climate fell more than expected as a recession looks increasingly likely.
Today’s Morning Lineup discusses earnings news out of Europe and the Americas, economic data from around the world, and much more.
With all the earnings and economic data on the calendar this week, investors will likely have a much better read on the economy and its direction on Friday. Several indicators have already pointed to the increased likelihood of a recession, and the yield curve has also been indicating a more precarious economic picture. While the spread between the yields on the 10-year and 2-year US Treasuries has been negative for three weeks now, the spread between the 10-year and the 3-month yields has yet to move to inverted levels. A few months ago, the relative steepness of the Fed’s preferred yield curve measure was cited as a reason why a recession was not in the cards. However, after flattening by nearly 200 bps to just 40 bps in the last three months, even this part of the curve (light blue line) looks much less comforting.

Start a two-week trial to Bespoke Premium to read today’s full Morning Lineup.
Jul 12, 2022
As of today, the percentage of inverted points on the yield curve reached the YTD highs seen in mid-June of 17.9%. This comes as the 10-year and 1-year invert, as well as the 5-year and 2-year. The inversion of points on the yield curve (particularly 2s&10s) tends to be cited as a leading recession indicator, due to the fact that higher near-term yields imply a higher risk in the near-term rather than the long-term, the inverse of what is typically true. The graph below shows the rolling percentage of inverted points on the curve over the last six months. Click here to learn more about Bespoke’s premium stock market research service.

As mentioned above, the spread between the 10-year and 1-year treasury inverted today, which is the first occurrence since October of 2019. Following prior inversions of this part of the yield curve since 1970, a recession has followed in the next two years 99.8% of the time which would suggest that a recession at some point in the next two years is almost certain. Following the first inversion in at least one year when a recession did follow, it has taken an average of 271 trading days to officially enter a recession. The shortest time it took to enter into a recession following 1s and 10s inversion was in 1973, when it took just 191 trading days. As mentioned, going back to 1970, recessions have followed within two years of an inversion 99.8% of the time. The only time that this part of the curve inverted and a recession did not follow within two years was after a brief stint in the fall of 1998.
