Dec 4, 2020
Our 2021 Bespoke Report market outlook is the most important piece of research that Bespoke publishes each year. We’ve been publishing our annual outlook piece since the formation of Bespoke in 2007, and it gets better every year! In this year’s edition, we’ll be covering every important topic you can think of that will impact financial markets in 2021.
The 2021 Bespoke Report contains sections like Economic Cycles, The Fed, Sector Technicals and Weightings, Stock Market Sentiment, Stock Market Seasonality, Housing, Commodities, and more. We’ll also be publishing a list of our favorite stocks and asset classes for 2021 and beyond.
We’ll be releasing individual sections of the report to subscribers until the full publication is completed by year-end. Today we have published the “Washington” section of the 2021 Bespoke Report, which recaps market scenarios under different political compositions in DC as well as some important comparisons between this election and 2016’s.
To view this section immediately and all other sections, become a member with our 2021 Annual Outlook Special!

Dec 4, 2020
Our 2021 Bespoke Report market outlook is the most important piece of research that Bespoke publishes each year. We’ve been publishing our annual outlook piece since the formation of Bespoke in 2007, and it gets better every year! In this year’s edition, we’ll be covering every important topic you can think of that will impact financial markets in 2021.
The 2021 Bespoke Report contains sections like Economic Cycles, The Fed, Sector Technicals and Weightings, Stock Market Sentiment, Stock Market Seasonality, Housing, Commodities, and more. We’ll also be publishing a list of our favorite stocks and asset classes for 2021 and beyond.
We’ll be releasing individual sections of the report to subscribers until the full publication is completed by year-end. Today we have published the “Valuation” section of the 2021 Bespoke Report, which compares current valuations for major indices and sectors to their historical levels at various points in bull and bear markets. We also analyze the earnings yield, price to book ratios, and dividend yields for the S&P 500 relative to history.
To view this section immediately and all other sections, become a member with our 2021 Annual Outlook Special!
Jul 21, 2020
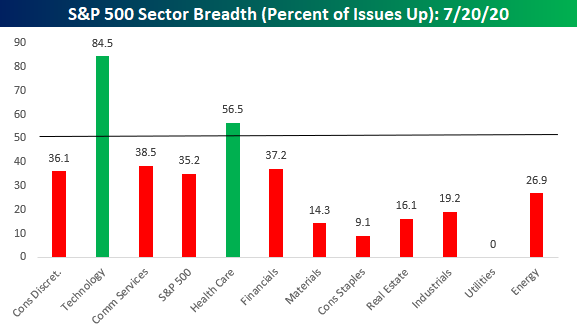
By just about all accounts, Monday’s breadth was extremely weak for a day on which the S&P 500 rallied 0.84%. In terms of sector performance, just three sectors were up over 1%, while four declined more than 1%. If you account for rounding, the 0.96% decline for Consumer Staples would make it five!

The chart of sector performance doesn’t even tell the entire story. While Consumer Discretionary was up the most yesterday at +3.14%, when Amazon.com (AMZN) comprises more than a quarter of the entire sector, it’s 8% rally can mask a lot of underlying weakness. The chart below shows the percent of stocks in each sector that finished the day in positive territory. As shown, barely a third of Consumer Discretionary stocks were even up yesterday! Technology and Communication Services were the only other sectors that outperformed the S&P 500 yesterday, and while breadth was extremely positive in tech-land, in Communication Services things weren’t much better than they were in the Consumer Discretionary sector. Besides Technology, Health Care was the only other sector that managed to see more than half of its components finish the day in positive territory.
Looking at breadth among sectors can show a bit of a misleading picture as so much market cap is concentrated into just a few sectors, while four other sectors (Energy, Materials, Real Estate, and Utilities) all have weightings of 3% or less in the S&P 500. Broadening out the picture a bit more, the chart below breaks down Monday’s performance by Industry Groups. At this level, breadth was still weak on Monday but not as bad as the picture on the sector level suggests. While five industry groups finished the day up over 1%, there were still seven that finished the day down over 1%. Still a large number, but not quite as extreme as the sector numbers would suggest. Like what you see? Click here to view Bespoke’s premium membership options for our best research available.

Jun 22, 2020
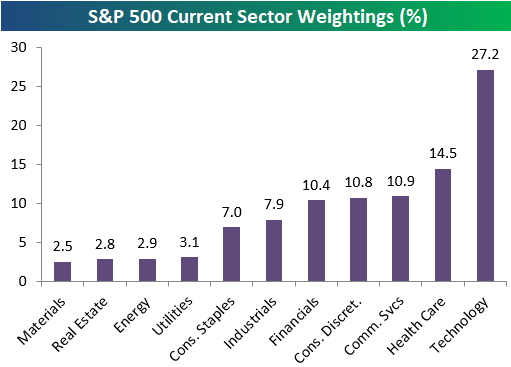
With Technology rallying and once again outperforming to start the new trading week, we wanted to note that the sector’s weighting in the S&P 500 has pushed above 27% recently up to 27.2%. That’s nearly twice as big as the next biggest sector in the S&P — Health Care — at 14.5%. Just three other sectors have weightings above 10%, and they’re all just only slightly above the 10% mark — Communication Services, Consumer Discretionary, and Financials. We’d note that Amazon (AMZN) makes up about a quarter of the Consumer Discretionary sector’s 10.8% weighting in the S&P, and while it is technically a retailer, between its web services division, and strong technology platform, you could argue that its just as much a Technology stock as it is Consumer Discretionary.
Industrials and Consumer Staples have seen their weightings dip below 8%, and the four smallest sectors each have weightings of just 2-3%.
At the moment, Tech’s 27.2% weighting in the S&P is larger than the weightings of the six smallest sectors combined.
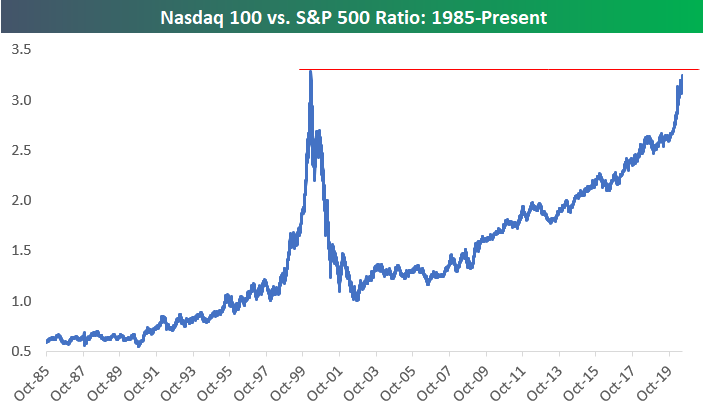
The tech-oriented Nasdaq 100 continues to outperform as well. Below is a chart of the ratio between the index levels of the Nasdaq 100 vs. the S&P 500. The ratio has been on a non-stop march higher since the end of the Dot Com bust in late 2002.
There have only been three trading days in history where the Nasdaq 100 to S&P 500 ratio was higher than the 3.25 level it’s at right now. Those three days came on March 8th, March 9th, and March 10th of the year 2000 — the very peak of the Dot Com Bubble.
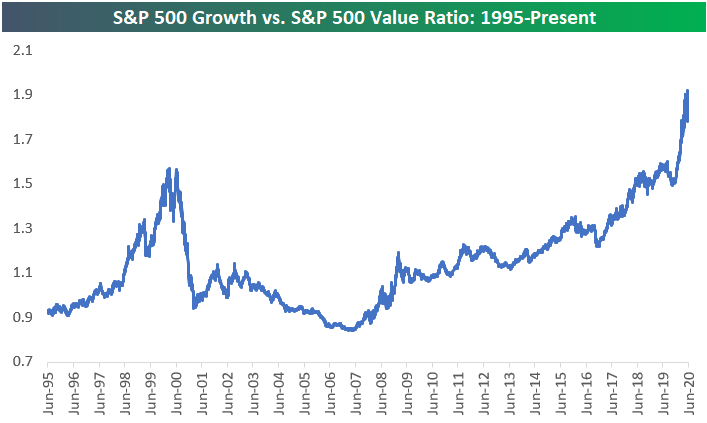
Finally, the Growth vs. Value trade remains lopsided towards growth. Below is a chart of the ratio between the S&P 500 Growth and S&P 500 Value index since 1995. This ratio actually took out its highs from the Dot Com Bubble in mid-2019, and it has exploded even higher over the last year. Value did outperform for a bit in May and early June, but over the last two weeks we’ve seen Growth soar and the ratio has once again made new highs. Click here to view Bespoke’s premium membership options for full access to all of our research.
Feb 20, 2020
Log-in here if you’re a member with access to the Closer.
Looking for deeper insight on markets? In tonight’s Closer sent to Bespoke Institutional clients, we begin by showing why the weightings of the homebuilders and semis are not sending any worrying signals. Next, we update out Five Fed Manufacturing composite with the releases of the Philadelphia and Empire State readings. We finish tonight with a look at EIA petroleum stockpiles.

See today’s post-market Closer and everything else Bespoke publishes by starting a 14-day free trial to Bespoke Institutional today!