May 11, 2018
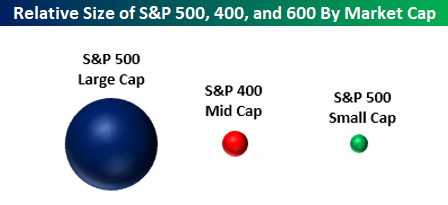
In this week’s Bespoke Report, one of the many topics covered was market weightings and market caps. The bubble chart below shows representations of the size of the large-cap S&P 500, the mid-cap S&P 400, and the small-cap S&P 600. When we speak with a lot of investors, we often hear these asset classes discussed like they are interchangeable. The reality is that they are very different. The S&P 500 is 29 times the size of the S&P 600 small cap index. Therefore, while it has little impact for an individual investor, collectively speaking, any new money in (or out) of the market will have a much more significant impact on small caps than it will on large caps. Think of it like dropping an ice cube in a full glass of water versus a bathtub.
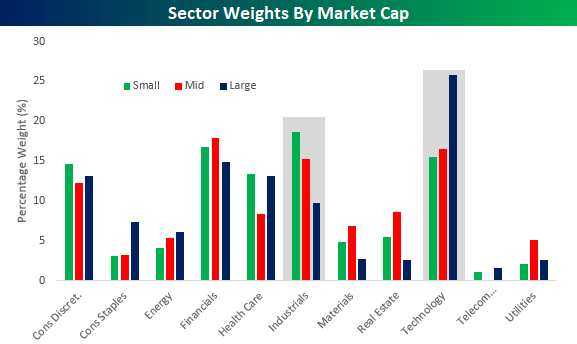
A second chart we wanted to highlight was sector weightings by market cap. While the Technology sector’s weighting is abnormally large in the S&P 500 large-cap index at over 25%, within the small and mid-cap indices, it is at a much more reasonable level of around 15%. In the small and mid-cap indices, the sector that has an abnormally large weighting is actually Industrials. Whereas the sector’s weight is under 10% in the S&P 500, it has a weighting of over 15% in the S&P 400 mid-cap index and a weight of over 18% in the S&P 600 small cap index.
With these weighting abnormalities in mind, when the Technology sector rallies, it has an exaggerated impact on large caps relative to small and mid caps, while an Industrials led rally has a more positive impact on mid and small caps.
As mentioned above, these charts are from our just-published weekly Bespoke Report newsletter, which provides an in-depth review of recent market action and events. To read this week’s Bespoke Report in its entirety, start a two-week free trial to any Bespoke membership level by clicking the button below.
Sep 2, 2015

Below is a snapshot of current S&P 500 sector weightings. As shown, Technology stocks currently makes up 20.01% of the index, while Telecom stocks make up just 2.45% of the index.
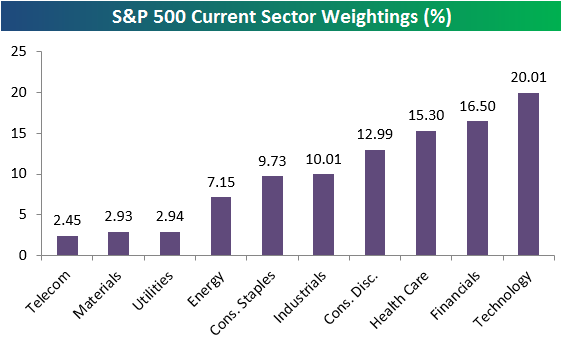
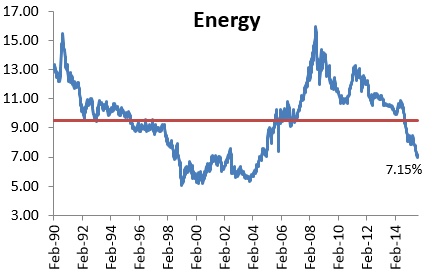
The reason we’re highlighting sector weights is to show just how much weight Energy has lost. After making up more than 15% of the S&P 500 when oil peaked back in early 2008, Energy has lost more than half of its weighting in the index. As of today, Energy stocks make up just 7.15% of the index, and it was in the 6s just a few days ago. With an average weighting of roughly 9.5% historically going back to 1990, Energy is currently well under its “normal” reading. That’s what happens when oil prices crash and the sector enters a bear market. If you’re a long-term investor that likes to “buy low and sell high,” you’d be “buying low” relatively speaking right now.
Enter “crude” in the coupon code section of our Bespoke Institutional subscribe page to receive 10% off the regular price for the life of the membership!

Mar 8, 2015
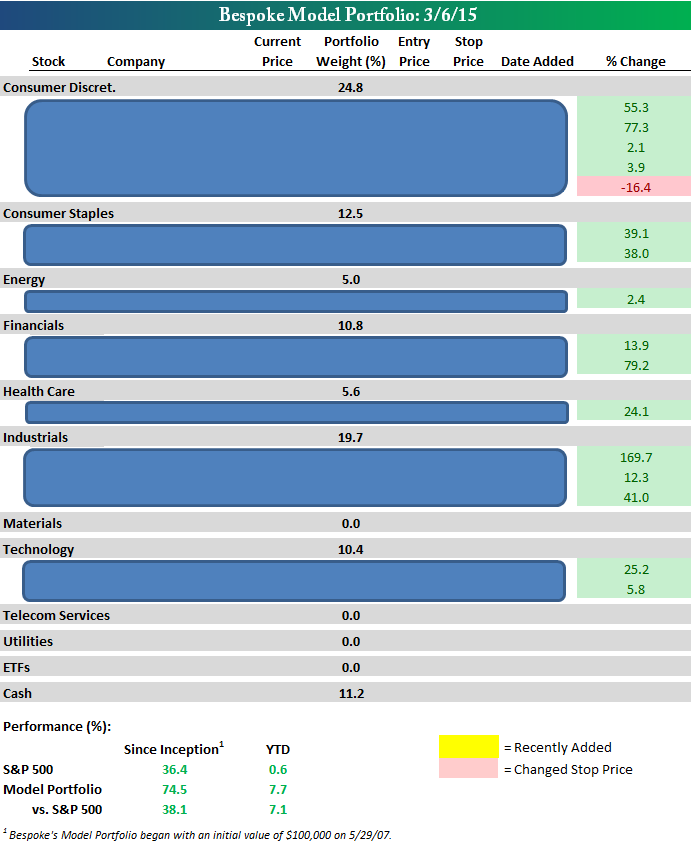
At the end of each week’s Bespoke Report newsletter, we publish an updated snapshot of our Bespoke Model Stock Portfolio. Below is a snapshot of the portfolio with sector weightings and performance numbers included, but the individual stocks are blocked out.
Interested in seeing the actual stocks that make up the Bespoke Model Stock Portfolio? Sign up for a 5-day free trial to our Bespoke Premium service and gain access now.

Feb 9, 2026
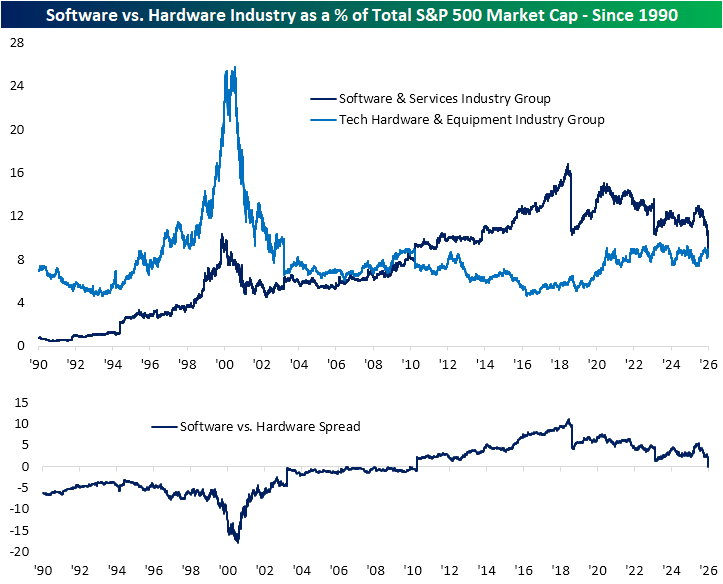
In the past couple of weeks, we have repeatedly highlighted the weakness in the software stocks. Fears that AI will pose a significant threat to the sector have caused large losses in terms of both price and weighting. In the charts below, we show the industry’s weighting in the S&P 500 versus other industries within the Tech sector. Last Thursday, the Software and Services industry saw its market cap as a share of total S&P 500 market cap fall below 9% for the first time since July 24, 2011. A significant portion of that drop has come from a dramatic move over the past several months; however, that is also in the context of a longer-term drawdown since the peak weighting in the summer of 2018, shortly before a reclassification that shifted several large-cap Tech names into other sectors.
The recent declines also put the software industry’s weighting on par with one of its peers in the Tech sector: the Tech Hardware and Equipment industry. In fact, at the low last Thursday, Software saw its weighting in the S&P 500 fall below that of Tech Hardware and Equipment for the first time since April 30, 2010. Whereas there have been steadier trends in software weighting over the long run, Hardware and Equipment has seen a relatively stable range of readings in the mid to high single digits since the early 2000s. That followed extremely elevated weights that crossed into the mid-20% range during the height of the Dot Com era. Fast forward back to today, even with the lower weighting in Software recently, Tech hardware hasn’t been picking up much.
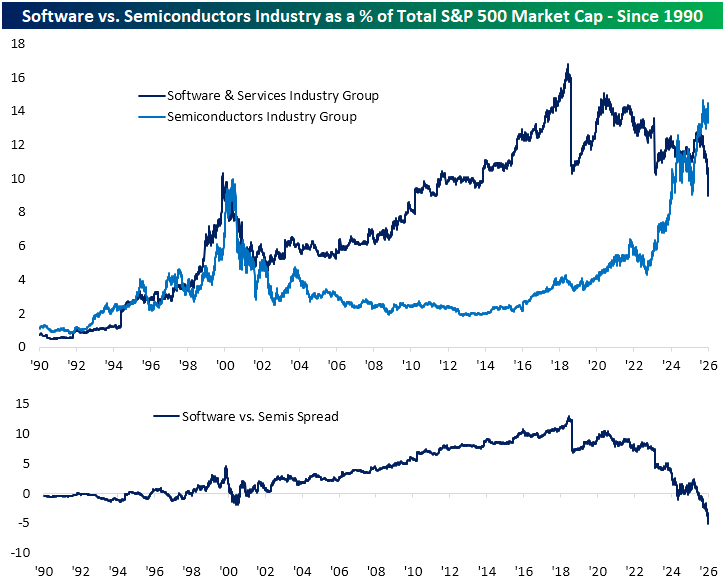
The third and final industry that comprises the Tech sector is Semiconductors, and its weight trend is the polar opposite. This is a group that has been an absolute star of the show since AI came to the mainstream in late 2022, and as a result, it is now hovering around a record share of the S&P 500’s market cap. Today, its weight is up to 14.3%, which is again still a far cry from the Tech Hardware and Equipment Industry over a quarter century ago. That also leaves software in the dust as there is now a record 5 percentage-point difference in the weightings of the two industry groups.

Nov 11, 2025
See what’s driving market performance around the world in today’s Morning Lineup. Bespoke’s Morning Lineup is the best way to start your trading day. Read it now by starting a two-week trial to Bespoke Premium. CLICK HERE to learn more and start your trial.
“The test of success is not what you do when you are on top. Success is how high you bounce when you hit the bottom.” – George S. Patton

Below is a snippet of commentary from today’s Morning Lineup. Start a two-week trial to Bespoke Premium to view the full report.
Futures are in hangover mode after yesterday’s big rally to start the week, which put a dent in a good chunk of last week’s decline. At this point, S&P 500 futures indicate just a modest decline of 0.2% at the open, while the Nasdaq is down twice that. The Treasury market is closed for Veterans Day, but both crude oil and gold are up about 0.8% while cryptocurrencies are lower. In Europe, the STOXX 600 is up another 0.8%, while Asian stocks were mixed.
Judging by the metrics of General Patton’s quote above, the bounce of last April’s low was one of the most successful of all time, and even the bounce off last week’s test of the 50-DMA has, initially at least, been successful. On this Veterans Day, we want to thank anyone who has served in the US Armed Forces for their service. Everyone in the country appreciates their service.
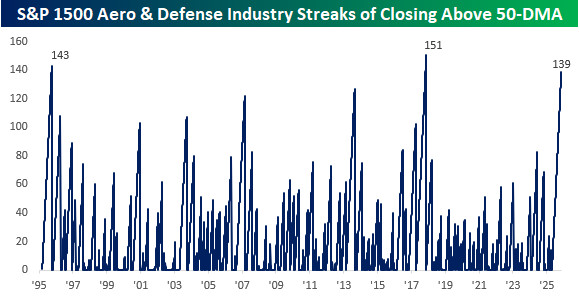
Given the Veterans Day holiday, we wanted to look at how aerospace and defense stocks have performed so far this year. From last November through early April, the group traded mostly sideways, so while it didn’t rally with the broader market to close out 2024, it didn’t feel much of the effects of the tariff-tantrum in March and April. Since those April lows, though, the sector has taken off and not looked back. Like the S&P 500, the group tested its 50-DMA last Friday but managed to bounce and stay above that level.
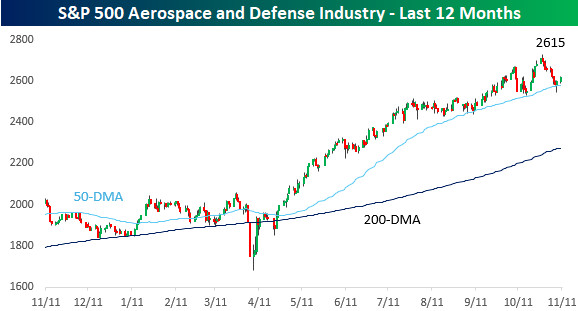
With the successful test of the 50-DMA, the Aerospace and Defense industry has closed above its 50-DMA for 139 trading days. That’s the longest streak since a record 151 trading days in 2017 and ranks as the third-longest in the last 30 years.