Dec 21, 2020
Our 2021 Bespoke Report market outlook is the most important piece of research that Bespoke publishes each year. We’ve been publishing our annual outlook piece since the formation of Bespoke in 2007, and it gets better every year! In this year’s edition, we’ll be covering every important topic you can think of that will impact financial markets in 2021.
The 2021 Bespoke Report contains sections like Valuation, The Fed, Sector Technicals and Weightings, COVID, Dollar & Stocks, Yield Curve & Fed, Commodities, and more. We’ll also be publishing a list of our favorite stocks and asset classes for 2021 and beyond.
We’ll be releasing individual sections of the report to subscribers until the full publication is completed by year-end. Today we have published the “Sector Weightings and Technicals” section of the 2021 Bespoke Report, which looks at historical trends in weightings for S&P 500 sectors, long-term sector chart patterns, and 2020 correlations across sectors and asset classes.
To view this section immediately and all other sections, become a member with our 2021 Annual Outlook Special!

Nov 27, 2020
For most of the past year, one significant trend on a sector by sector basis has been the outperformance of sectors like Technology and Consumer Discretionary. The relative strength lines of these sectors have consistently shown outperformance versus the rest of the S&P 500 as a whole, but since August, other sectors have begun to take the wheel. As we noted in today’s Sector Snapshot, just about every sector has had a banner month in November with some of the biggest month to date rallies of the past 30 years, but some sectors have seen much larger returns than others. One of the best examples of this has been Energy which has risen over 35% in November. Similarly, Financials has risen an astounding 19.5% this month compared to more modest but still significant rallies of around 10% from Tech and Consumer Discretionary. Given those large degrees of outperformance, the relative strength lines of Energy and Financials have taken a sharp turn higher in recent weeks. Similarly, they have seen a turnaround in their weightings in the S&P 500 as shown in the charts below.
Over the past three months, the Financial sector has gained a full percentage point weighting while the Technology sector has lost 1.36 percentage points with a decline in weighting in three straight months. For Financials, that is the largest gain in weighting in a three month span since January 2017. For Tech, outside of the reshuffling in 2018 that saw a large share of its weight change into Communication Services, the last time the sector lost this much or more in weighting in three months was November of 2008. Prior to this recent string of losing weight over the past three months, Tech had seen weight gain in every month from October of last year through August. Even though the weight loss has been significant, it has only put a dent in the increased share of the entirety of the past year as the sector’s weight is only back down to where it was in May.
Similarly, looking at the other sectors, while Financials have added a full percentage point in share over the past few months, that follows nine months of declines running from last December through August. That brings the sector’s weighting back above 10% in the S&P 500, but that is only at the highest level since March. Similarly, Materials and Industrials have also seen their weights rise for three and four months in a row, respectively. As for Energy, the 0.44 percentage point gain in November is set to snap six straight months of declines; the longest such streak since at least 1990. As with Financials, that turn around this month has only put a dent in the longer term trend of weight loss as Energy’s weighting is now only back to its highest level since July. Opposite of Energy, Consumer Discretionary is on pace to lose weight for the first time since March. Click here to view Bespoke’s premium membership options for our best research available.

Jan 27, 2020
The S&P 500 Energy sector ETF (XLE) tried to break out of its downtrend in late 2019, but the bounce has been completely erased as of today with it plunging to new 52-week lows. Talk about an ugly chart. Start a two-week free trial to Bespoke Institutional to access our Bespoke Report, Chart Scanner, custom portfolios, and much more.

Remarkably, the Energy sector now has a weighting in the S&P 500 with a 3-handle – 3.97% to be exact. That’s less than 50 basis points larger than the Utilities sector, and less than 1.5 percentage points away from being the smallest sector in the entire index (which currently belongs to Materials at 2.52%).

Only twelve years ago, the Energy sector was less than 0.70 percentage points away from being the largest sector in the S&P 500. In mid-2008, the Energy sector’s weighting peaked at 15.96%, which was 67 basis points below Tech’s weighting of 16.63% at the time. Below is a long-term chart of the Energy sector’s weighting in the S&P 500 since 1990. The red line shows its average weighting of 9.03% over this time period. At current levels, Energy’s weighting is more than 50% below its historical average and easily at its lowest level of the last 30 years.

Below is a 10-year performance comparison of the S&P 500 Energy sector (XLE) versus the S&P 500 (SPY). As shown, XLE is now down 1.84% in price over the last ten years, while SPY is up 195.1%.

Below is a chart of XLE going back further to 1999 when the ETF began trading. From 1998 through mid-2008, the Energy sector was one of the best sectors to be in. It fell with everything else during the Financial Crisis and then managed to recover all of its losses and make new highs in 2014. It’s really only the last five years where the bottom has fallen out, especially relative to the rest of the stock market.

If we compare the price change of XLE to SPY since 1999, SPY has actually only recently overtaken the Energy sector in terms of performance. XLE is up 137% since the start of 1999 while SPY is up 169%. Just over five years ago, XLE was up more than 300% since 1999 versus SPY’s gain of 65%.

Jul 10, 2019
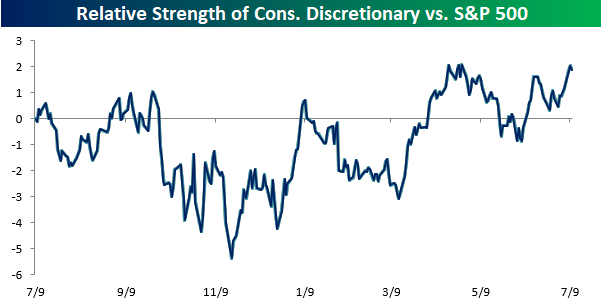
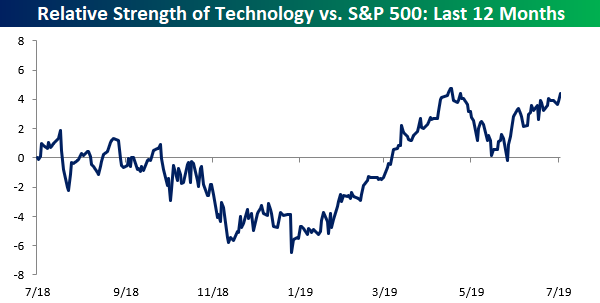
It was a monumental milestone for the S&P 500 earlier today as the index briefly crossed 3,000 for the first time in its history. While the S&P 500 traded up to a new all-time high, it was interesting to see that not a single sector made a new high in terms of their relative strength versus the index. The only two sectors where relative strength is even close to a 52-week high versus the S&P 500 are Consumer Discretionary and Technology. Just two sectors hitting new highs on a relative basis may not sound too impressive, but when those two sectors account for nearly one-third of the entire index, it’s not as bad.


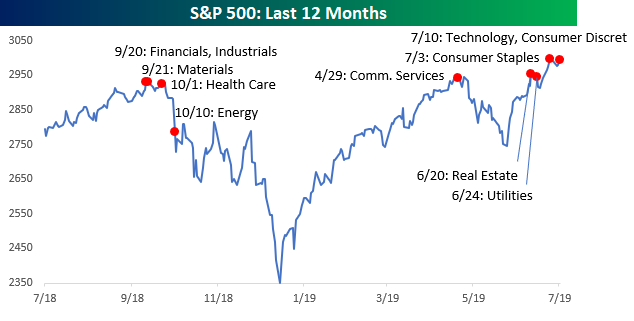
While no sectors are hitting new highs today on a relative basis, a number of sectors have recently hit new highs on an absolute basis. The chart below shows the S&P 500 over the last year, and on it we have notated the date of each sector’s 52-week high. When the S&P 500 recently first made a new high, the rally was being led by defensives like Real Estate and Utilities which made their highs on 6/20 and 6/24, respectively. On 7/3, another defensive sector joined the fray as Consumer Staples rallied to a new high. Today, we are finally beginning to see some non-defensive sectors get in on the act as both Consumer Discretionary and Technology made new highs. Trailing way back in the dust of these sectors are Financials, Industrials, Materials, and Health Care, which haven’t made new highs in over eight months. If these sectors can make it over the hump, the S&P will likely be in the midst of a big leg higher. Start a two-week free trial to Bespoke Institutional to access our full research suite.

Dec 19, 2018
Our 2019 Bespoke Report market outlook is the most important piece of research that Bespoke publishes each year. We’ve been publishing our annual outlook piece since the formation of Bespoke in 2007, and it gets better and better each year! In this year’s edition, we’ll be covering every important topic you can think of dealing with financial markets as we enter 2019.
The 2019 Bespoke Report contains sections like Washington and Markets, Economic Cycles, Market Cycles, The Fed, Sector Technicals and Weightings, Stock Market Sentiment, Stock Market Seasonality, Housing, Commodities, and more. We’ll also be publishing a list of our favorite stocks and asset classes for 2019 and beyond.
We’ll be releasing individual sections of the report to subscribers until the full publication is completed by year-end. Today we have published the “Sector Analysis” section of the 2019 Bespoke Report, which looks at S&P 500 sector weightings, technicals, and correlations.
To view this section immediately and all other sections, sign up for our 2019 Annual Outlook Special!


