Apr 26, 2017
The charts below are part of our semi-monthly update on short interest for stocks in the S&P 1500. To gain access to these charts for every sector and group in the S&P 1500, start a 14-day free trial to Bespoke’s research today!
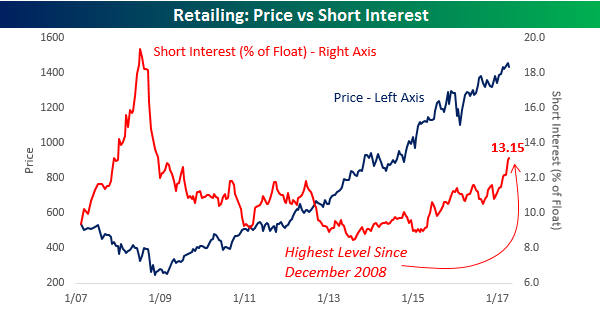
Short interest figures for the middle of April were released after the close on Tuesday, and in what has become a consistent trend over the last several months, traders continue to pile into the Death By Amazon trade. The chart below compares the price of the S&P 1500 Retailing Index (left axis) to the average level of short interest (as a percentage of float) for stocks in the group (right axis). After hitting its lows for the bull market in mid-2013, the average level of short interest started trending higher and the pace really began to accelerate to the upside in early 2015. Since then, the pace of increase has only accelerated and currently stands at 13.15%. That’s the highest reading for the group since December 2008! Looking at the chart, it would appear as though investors who are shorting the group are getting taken out to the woodshed as the group’s price is right near bull market highs. This chart is quite misleading, though, as stocks like Amazon.com (AMZN) and Home Depot (HD) mask the overall trend. Underneath the surface, there is a lot of weakness in individual names.
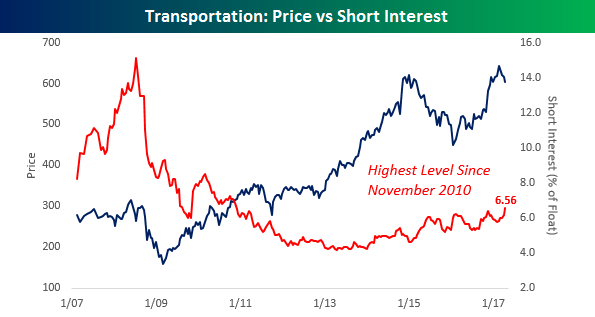
Another group that has seen a rather steady but unnoticed increase in its average level of short interest is the Transportation group. While short interest in these stocks is nowhere near as high as it is in the Retailing group, at a level of 6.56%, the group’s average short interest as a percentage of float is the highest it has been since November 2010.
Mar 24, 2017
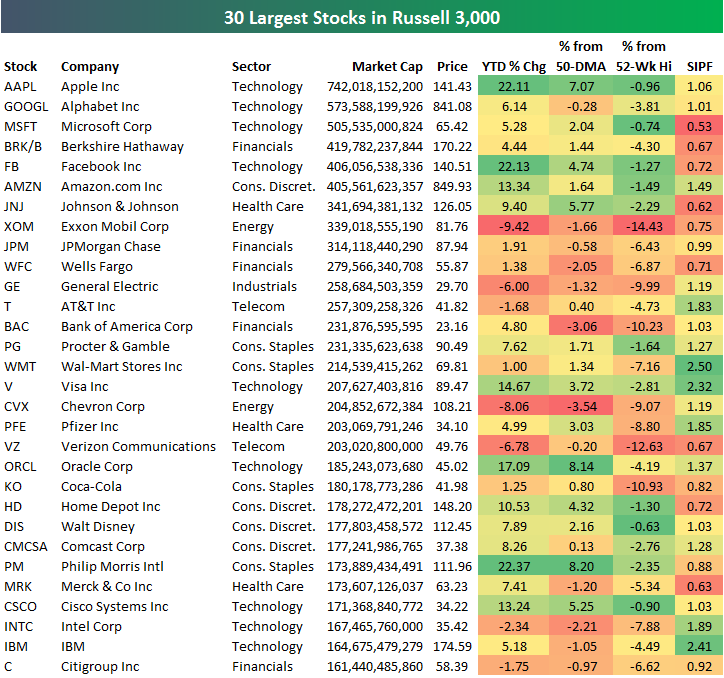
Below is a look at the 30 largest publicly traded US stocks (based on market cap). As shown, Apple (AAPL) sits at the top by a wide margin after posting a 22% YTD gain thus far in 2017. The stock is currently 7% above its 50-day moving average and less than 1% from its all-time high. Alphabet (GOOGL), Microsoft (MSFT), Berkshire Hathaway (BRK/B), and Facebook (FB) round out the top five, and all have market caps greater than $400 billion. Amazon.com (AMZN) is less than half a billion in market cap away from Facebook (FB), leaving AMZN in the #6 spot. Exxon Mobil (XOM), which was the largest company in the world for many years until Apple (AAPL) eclipsed it, now ranks as the 8th largest company in the US. Even Johnson & Johnson (JNJ) is now bigger than XOM.
Along with Berkshire, two additional Financial sector stocks rank in the top ten. JP Morgan (JPM) and Wells Fargo (WFC) rank #9 and #10.
Like Exxon, another company that used to sit at the top of this list is General Electric (GE). With a market cap of $258 billion, GE doesn’t even crack the top ten at this point. Wal-Mart (WMT) is yet another name that used to sit at or near the top, but now the company is only the 15th largest company in the US. Remarkably, online retail giant Amazon.com has a market cap that is nearly double the size of Wal-Mart. There’s no better example of “Death by Amazon” than that.
If you like Bespoke’s research, become a Bespoke Premium or Bespoke Institutional member today.
Feb 7, 2017
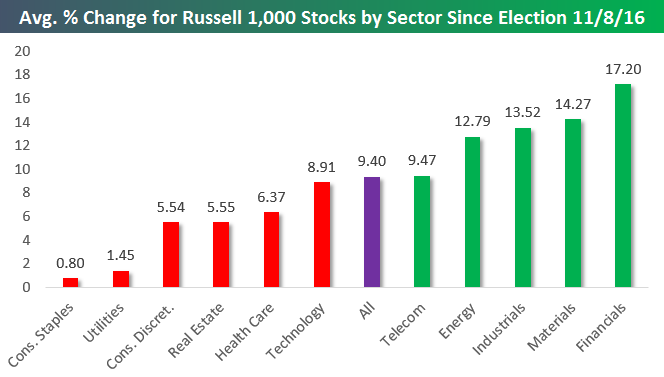
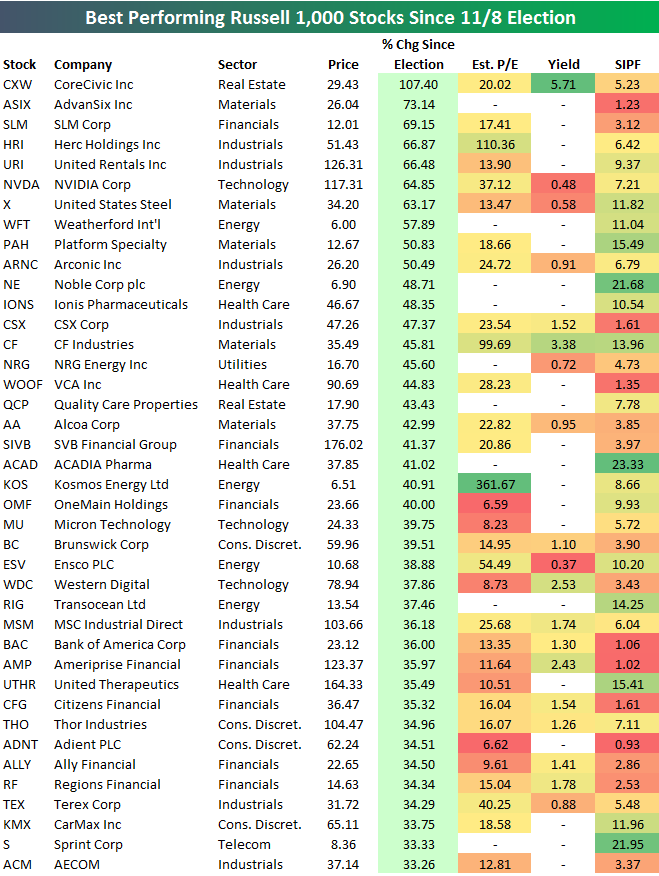
Below is a look at the average performance of Russell 1,000 stocks by sector since the close on election day (11/8/16). As shown, the average stock in the entire index is now up 9.4% since election day. Five sectors have seen outperformance while six have seen underperformance.
The Financial sector is averaging the biggest gains at +17.20%, followed by Materials (+14.27%), Industrials (+13.52%), and Energy (+12.79%). While Technology has been outperforming recently since the election the average Tech stock is up 8.91%, which is actually less than the overall average. The real laggards have been Consumer Staples and Utilities. Both sectors have seen their stocks average very minute gains.
Below is a list of the 40 Russell 1,000 stocks that are up the most since election day (through the close on 2/6). As shown, CoreCivic (CXW) — a REIT — is up the most with a gain of 107.4%, followed by AdvanSix (ASIX), SLM, and Herc Holdings (HRI). United Rentals (URI), NVIDIA (NVDA), and US Steel (X) rank 5th through 7th. Other notables on the list of big winners include Alcoa (AA), Micron (MU), Western Digital (WDC), Bank of America (BAC), and Sprint (S). For each name, we also include its estimate P/E ratio, its dividend yield, and its short interest as a percentage of float (SIPF).
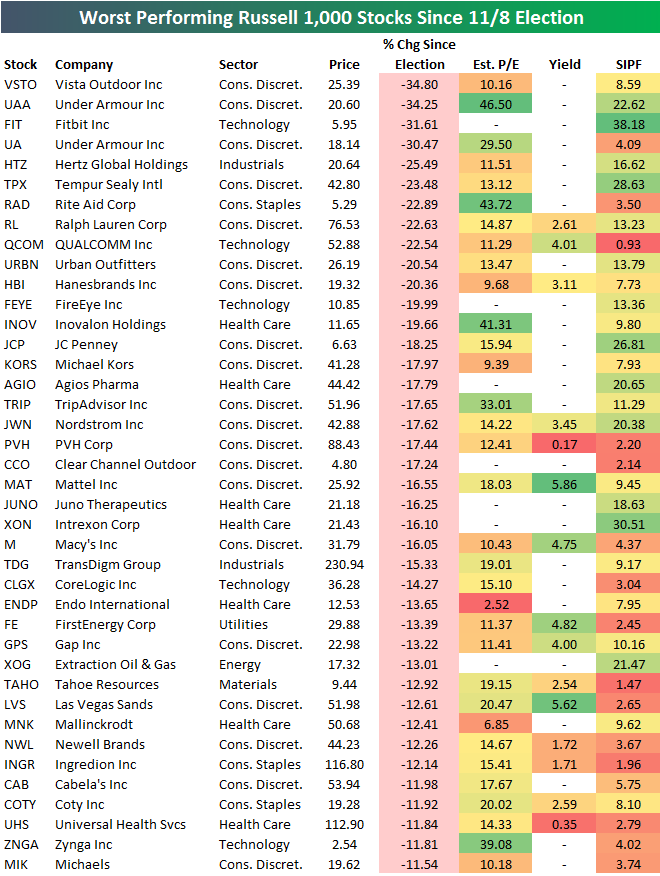
The list of biggest losers since election day is led by Vista Outdoor (VSTO) and Under Armour (UAA), which have both declined more than 34%. Fitbit (FIT) ranks third worst with a decline of 31.61%. Other notables on the list of losers include Ralph Lauren (RL), QUALCOMM (QCOM), FireEye (FEYE), JC Penney (JCP), Nordstrom (JWN), Macy’s (M), and Las Vegas Sands (LVS). The list is riddled with retailers and other consumer stocks that are suffering “Death by Amazon.”
Jan 27, 2017
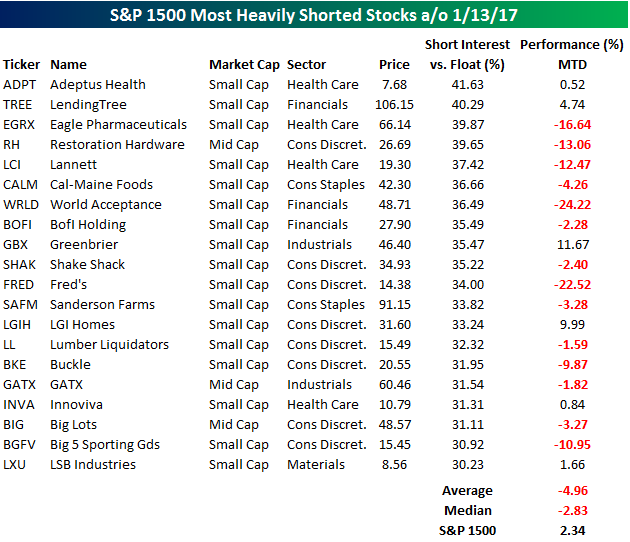
Short interest figures for the middle of January were released after the close Wednesday and as the rally in equities stalled out, traders took the opportunity to add some shorts to their books hoping that the stall would turn into a downdraft. The table below lists the 20 stocks in the S&P 1500 that have 30% or more of their free-floating shares sold short, and for each stock we also include how they have fared so far in 2017. Even though equities have rallied so far this year, the most heavily shorted stocks have completely sat out of the rally. The average return of the 20 stocks listed is a decline of 4.96% (median: -2.83%). In terms of breadth, it’s just as weak with only six out of the twenty stocks posting YTD gains.
The primary culprit behind the declines in the most shorted stocks this month is the consumer. Of the 20 names listed, eight are from the Consumer Discretionary (6) or Consumer Staples sectors (2), and of those stocks just one (LGIH Homes) is up YTD. Collectively, these stocks are down an average of 6.1% on the year, while the other 12 stocks are down an average of less than 4%. We’ve been discussing the ‘bricks to clicks’ trade and our Death By Amazon index for several years now, but based on the performance of many consumer related stocks so far this year, a lot of investors in the sector seem to still just be figuring it out.
Interested in a more in-depth analysis of short interest trends? Yesterday, we published our bi-monthly short interest report, which is available to all Bespoke Premium and Institutional clients. Click here to start a no-obligation 14-day free trial now.
Mar 18, 2016
Last week, we posted an example of how our Bespoke Consumer Pulse work has been extremely helpful in guiding our views on AAPL. Below we provide similar insights into how Consumer Pulse shapes our view on AMZN. As a reminder: we have been using our proprietary consumer surveys for years to get a “from the source” view of what consumers are really feeling and doing. The 2,000 person monthly survey has become an integral part of our process.
Even though we’ve never liked AMZN stock from a valuation perspective (who has?), the wealth of information we’ve gotten through Consumer Pulse has significantly impacted our views. In fact, the data inspired our “Death By Amazon” index, which tracks how a select group of retail stocks are doing compared to AMZN. Let’s just say that the “Death by Amazon” performance is more than justified based on our survey data. Here are a few things we’ve learned:
- Our surveys consistently show that everyone is buying everything from Amazon. Among people making over $200k per year, a whopping 75% have purchased something from Amazon in the past month.
- The number of people who say they have NOT visited a drug store or department store in the past month is consistently going higher in every monthly survey.
- We learned through our surveys that Amazon Prime subscribers were growing 50% year over year…and we got that data three weeks BEFORE management announced it.

As we’ve said before, investors would be hard pressed to find a better value on research than Pulse. Surveys with similar breadth and depth cost thousands of dollars per month or tens of thousands per year to replicate.
Bespoke subscribers can purchase our Consumer Pulse survey analysis for just $365/year or $39.99/month (including a 30-day free trial). Non-subscribers can purchase it as a stand-alone product for $995/year or $99/month (also with a 30-day free trial). We strongly encourage you to give our Consumer Pulse subscription a try by choosing one of the 30-day free trial options below:
As a non-member, you can purchase Consumer Pulse below as a stand-alone product, or subscribe to one of our other memberships and get a big discount on Consumer Pulse.
Annual — Bespoke Consumer Pulse — $995/Year w/ 1-Month Free Trial
Monthly — Bespoke Consumer Pulse — $99/Month w/ 1-Month Free Trial