Rich Valuation for Tech
Positive developments on the trade front over the past couple of days have been a tailwind for the Technology sector, which has exposure via trade heavy industries like the semiconductors. As the sector’s price has risen, so have valuations. Keeping track of valuations using our Daily Sector Snapshot included with the Morning Lineup and Closer, we have been repeatedly noting that the Technology sector has seen its price-to-earnings ratio consistently in the upper end of the past decade’s range recently.
In fact, with yesterday’s rally further elevating price, the P/E ratio is now in the 100th percentile of all readings of the past ten years. In other words, the 25.5 P/E yesterday was the highest of the past ten years. The last time the ratio was this high or higher was back on November 7th of 2007. Although the valuation is undoubtedly elevated now, the P/E ratio is actually still well off of its highs and only in the 68th percentile of all readings of the past 25 years. As shown below in the chart of the sector’s P/E ratio over the past quarter-century, the current level has rarely been observed since the end of the Dot-Com Bubble. But the ratio is also still well below levels seen during the bubble in the late 1990s. Additionally, the build-up to current levels has been much more gradual than around that time. Simply put, while the sector’s valuation has run hot, it’s not even close to what we saw during the 90s heyday for Tech. Click here to learn more about Bespoke and its research offering.

B.I.G. Tips – Retail Sales Disappoint
B.I.G. Tips – CAT Sales Flatline
Bespoke’s Morning Lineup – 12/13/19 – Dollar Breaks Down
See what’s driving market performance around the world in today’s Morning Lineup. Bespoke’s Morning Lineup is the best way to start your trading day. Read it now by starting a two-week free trial to Bespoke Premium. CLICK HERE to learn more and start your free trial.

The Closer – Cyclical Swing, Soft PPI, Flow of Funds, Auction Analysis – 12/12/19
Log-in here if you’re a member with access to the Closer.
Looking for deeper insight on markets? In tonight’s Closer sent to Bespoke Institutional clients, we review the market reaction to news that China and the US have come to an agreement on trade. We also take a look at the technical setups of the USD and copper before recapping today’s very strong 30 year bond auction. Turning to macroeconomic data, we review today’s PPI data which missed expectations. We also give an update to quarterly flow of funds data released today by the Fed.

See today’s post-market Closer and everything else Bespoke publishes by starting a 14-day free trial to Bespoke Institutional today!
Bespoke’s Sector Snapshot — 12/12/19
Investors Slightly More Positive
Although the survey would not have caught any sentiment changes as a result of equities’ rally today, the weekly investor sentiment survey from AAII rose this week to 37.63% after dropping to 31.72% last week. That only brings it back up towards the levels from one month ago when bullish sentiment peaked just above 40%. While getting closer, this week was also the fourth in a row in which bullish sentiment was below its historical average of 38.07%.

The bulls’ gains were the bears’ loss as the percentage of investors reporting as pessimistic fell by over three percentage points. Like bullish sentiment, bearish sentiment is also still below its historical average of 30.36% but by a wider margin. Granted, this is not extended to any extreme degree as it is still well within one standard deviation of that average. In other words, both bearish and bullish sentiment has shifted more positive but not by a significant amount.

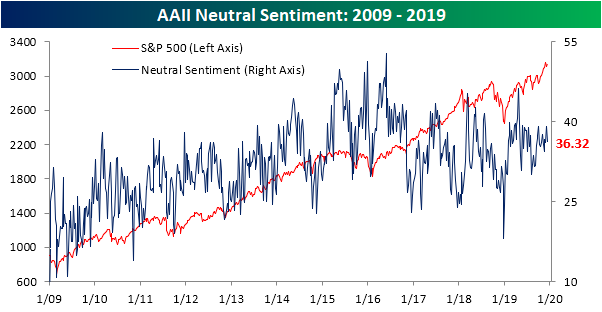
Given the bull-bear spread is at its widest in a month, neutral sentiment has also pulled back in the past week falling to 36.32%. This comes after last week saw one of the higher readings for neutral sentiment this year. With bullish sentiment borrowing from the neutral camp, there is a higher percentage of investors reporting as bullish than either neutral or bearish for the third time in a month. Start a two-week free trial to Bespoke Institutional to access our interactive economic indicators monitor and much more.
Cumalative A/D Line Joins S&P 500 At New High
Like the S&P 500 index itself, the Cumulative A/D line, which measures the net daily number of stocks in the index rising or falling, also hit a new high today. For the last two years now, the cumulative A/D line has consistently either tracked or led the S&P 500 to new highs, and today’s new high is just the latest example.
With equities starting to fade into the lunch hour today after the President’s ‘VERY” impactful tweet on trade, we’ll be watching to see if the new highs in both price and breadth can hold into the close. We would note, though, that breadth hasn’t seen as large of a pullback as price which is a bit encouraging. Start a two-week free trial to Bespoke Institutional to access our 2020 Outlook Report, interactive tools, and much more.

Don’t Fret About Higher Claims
Fingers were crossed that this week’s initial jobless claims would help to bring some clarity after the past month has seen a couple of low readings and a couple of elevated readings. Unfortunately, that did not happen as claims spiked to their highest level since September of 2017 at 252K. That was a 49K rise from last week and a 38K miss relative to forecasts. That is both the largest WoW increase and the widest miss since September 2017.

Additionally, this massive surge in claims has brought an end to the record streak in which claims have come in at or below 250K. Granted, the streak at or below 300K is still going strong at 249 weeks. That’s nearly five years!

While there was some help from an elevated reading of 227K rolling off of the four week moving average this week, the 252K that replaced it has sent the average 6.25K higher to 224K. That is the largest one week increase since the first week of May when it rose by 7.75K. Similarly, the last time the four week moving average was as high or higher than the current reading was on May 10th when it rose to 225K.

While at first glance this massive increase in the context of relatively flat claims over the past year may seem like a concern, more than likely it all comes down to pure seasonality especially as Thanksgiving arrived later this year. As shown in the chart below, the current week of the year has historically been the most volatile for seasonally adjusted initial jobless claims. The standard deviation for the weekly changes is at 26.98, nearly double the average standard deviation (13.96) for all weeks of the year.

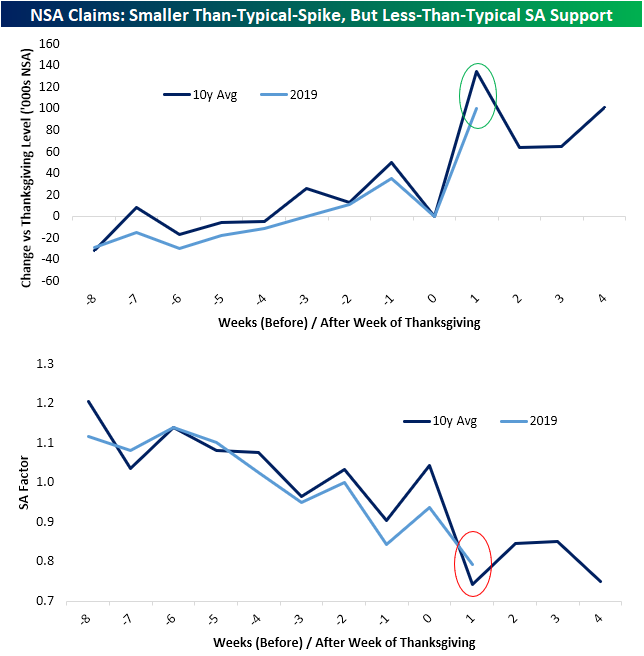
Turning to the non-seasonally adjusted data, claims also rose dramatically totaling 317.5K compared to 216.8K last week. That is the first time NSA claims rose by over 100K in a single week since December 2017. Again, while at first glance, the fact that it was a 56K YoY increase and the highest number for the current week of the year since 2016 may be concerning, it most likely can be chalked up to seasonality around the holidays and a later Thanksgiving.

To emphasize this, we normalized the data around the Thanksgiving holiday. As shown in the charts below, for the NSA data, this year has actually seen a smaller than average spike in the weeks following the holiday when compared to the past decade’s average. And when it comes to the SA number, the seasonal factor used in adjusting the NSA data was larger than average this week. Start a two-week free trial to Bespoke Institutional to access our interactive economic indicators monitor and much more.