Claims Remain Rangebound
Initial jobless claims improved this week, falling to 211K from an upwardly revised 219K last week. This 8K decline was larger than expected as forecasts were calling for claims to fall to 215K. Jobless claims remain in the range of the past few months and are also the lowest since the 210K print in the first week of October. With this week’s print, claims have now held at or below 300K and 250K for record streaks of 244 and 109 consecutive weeks, respectively.

The four-week moving average, which helps to smooth out the line by removing some of the week to week fluctuations, rose this week to 215.25K.
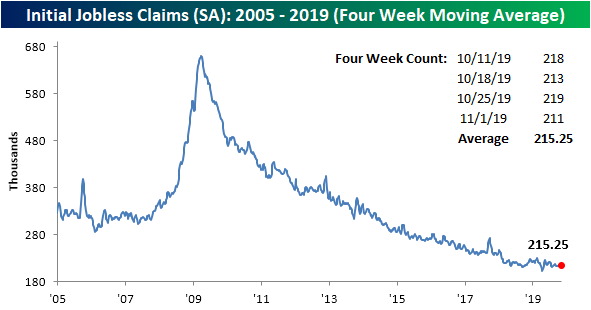
While still strong, claims have not done much recently as they have simply meandered sideways. In the past month alone, the four-week moving average has been in a range between 215K and 216K. As shown in the chart below, the 4-week moving average has been extremely rangebound over the past 3 months. With just 4.25K between the past 12 week’s highest and lowest readings, the moving average has been in the tightest range since August of 2017 when that range was 4K. Going back before that, times that the 12-week range falls below 5K have been few and far between. The only other time in the history of the data with a range of 5K or tighter was in July of 1973. At that time, claims stood around 230K and 240K. Those past occurrences did not see these tight ranges stay in place for extended periods of time as the range typically began to widen afterward. In regards to recessions (gray shaded regions on the chart), while they often follow a sharp widening that was preceded by a tight range, tight ranges by themselves are not necessarily an early warning sign. While the 1973 period was followed by a recession, just two years ago we saw a similarly narrow range with no recession. There have also been many other periods where the spread narrowed to similarly tight levels right in the middle of economic expansions.

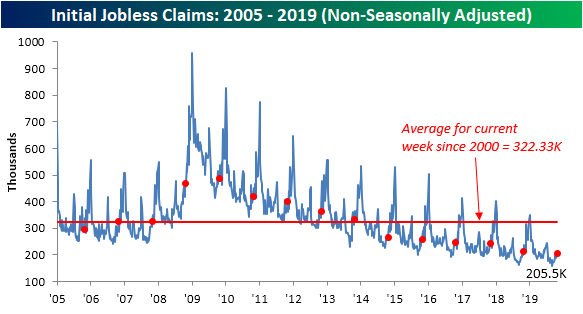
As is the norm for this time of year, non-seasonally adjusted claims have continued to rise this week. Now up to 205.5K from 198.7K last week, NSA claims are at their highest level since July. While seasonally adjusted claims have been rangebound, the NSA data did fall year-over-year. One year ago, NSA claims stood at 214.8K. Start a two-week free trial to Bespoke Institutional to access our interactive economic indicators monitor and much more.
New Highs for the Transports of Today and Yesteryear
The S&P 500 is trading at another new all-time high today and one development that has a lot of technicians excited is that the Dow Transports is also poised to close at a new all-time high as well. For many market watchers, the new high in the Transports helps to serve as confirmation of the rally in the overall market. For these investors, the emphasis on the Transports stems from the fact that companies in this index were always involved in moving goods from point A to point B, and therefore, these stocks would be the first to reflect strength or weakness in the broader economy. With the Transports on pace to close at an all-time high for the first time in over a year today, the strength helps to serve as confirmation of the broader market rally.
![]()
While transportation stocks are still heavily involved in the moving of goods across and into and out of the United States, the US economy of the 21st century is not the same economy of the 20th century. Economic activity today is much more service and digitally-oriented than manufactured and goods oriented. Because of the shift, the importance of the transports as a leading indicator of the economy has lost some of its relevance. We have contended for some time that the ‘transports’ of today’s 21st-century economy are the semiconductors as they are embedded in just about every aspect of our lives from computers to cellphones and even toilets!.
Whether you look to the semis or the transports as a market leader, today it doesn’t really matter. That’s because just as the Dow Transports hit a new high this morning, so too did the Philadelphia Semiconductor Index (SOX). Today’s rally for the SOX only made a marginal new high, but with the index at all-time highs and sitting on a 51% YTD gain, they don’t seem to be anticipating anything much in the way of a slowdown. Sign up for Bespoke’s “2020” special and get our upcoming Bespoke Report 2020 Market Outlook and Investor Toolkit.

Bespoke’s Morning Lineup – 11/7/19 – Use the Positive Trade Headline Today
See what’s driving market performance around the world in today’s Morning Lineup. Bespoke’s Morning Lineup is the best way to start your trading day. Read it now by starting a two-week free trial to Bespoke Premium. CLICK HERE to learn more and start your free trial.

The Bespoke 50 Top Growth Stocks — 11/7/19
Every Thursday, Bespoke publishes its “Bespoke 50” list of top growth stocks in the Russell 3,000. Our “Bespoke 50” portfolio is made up of the 50 stocks that fit a proprietary growth screen that we created a number of years ago. Since inception in early 2012, the “Bespoke 50” has beaten the S&P 500 by 106.4 percentage points. Through today, the “Bespoke 50” is up 229.4% since inception versus the S&P 500’s gain of 123.0%. Always remember, though, that past performance is no guarantee of future returns. To view our “Bespoke 50” list of top growth stocks, please start a two-week free trial to either Bespoke Premium or Bespoke Institutional.

The Closer – Live By The Trade, Die By The Trade – 11/6/19
Log-in here if you’re a member with access to the Closer.
Looking for deeper insight on markets? In tonight’s Closer sent to Bespoke Institutional clients, we begin with commentary on markets’ relationship to trade headlines and today’s strong 10 year note auction. We then provide an analysis on Uber (UBER) seeing as pre-IPO investors could sell their stock for the first day today. Switching over to macroeconomic data, we show what has driven slower labor productivity growth. We finish with our weekly looks at EIA petroleum data and ICI Fund Flows.

See today’s post-market Closer and everything else Bespoke publishes by starting a 14-day free trial to Bespoke Institutional today!
The Few, the Lowly, the Laggards
With less than two months left to go in 2019, the S&P 500 is sitting on a gain of nearly 23% YTD, and all but two of the index’s 24 industry groups are up by at least double-digit percentages. The two laggards are Energy (+4.5%) and Drugs and Biotechs (+5.5%), while the three strongest groups are all from the Technology sector (Tech Hardware: +44.8%, Semis: +37.7%, and Software: +32.8%). Surprisingly enough, Banks are even starting to move up the performance list as that group is up just a hair under 30% on the year putting it in fifth place on a YTD basis.
The table below lists where each of the S&P 500’s Industry Groups is currently trading with respect to its 50-DMA. While you would expect just about everything to be extended after the recent leg higher, that’s not the case. The S&P 500 as a whole is just 3% above its 50-DMA, and just five groups are more than 5% above their 50-DMAs. The two most extended groups are Tech Hardware (think Apple) and Banks. On the downside, there are actually as many Industry Groups trading below their 50-DMAs as there are groups trading more than 5% above their 50-DMAs. As shown at the bottom of the table, Consumer Services, Real Estate, Household & Personal Products, Commercial Services, and Utilities are all currently below their 50-DMAs. These aren’t groups that have been lagging the market all year. In fact, three of them are outperforming the S&P 500 on a year to date basis, but in the majority of cases, these are defensive-oriented groups that have fallen out of favor as the market’s sentiment has shifted and rates have risen. Sign up for Bespoke’s “2020” special and get our upcoming Bespoke Report 2020 Market Outlook and Investor Toolkit.

Chart of the Day: 12 Top Triple Plays
Dividend Stock Spotlight: Legget & Platt (LEG)
Legget & Platt (LEG) manufactures a wide array of home and automobile furnishings. The stock had a banner month in October, notching a 25.3% gain; the fourth-best performer in the S&P 500 in October behind Align (ALGN), Tiffany & Co. (TIF), and Biogen (BIIB), which rose over 39%, 34%, and 28% respectively. As with many of the other top performers last month, earnings gave a considerable boost to the rally. Reporting better than expected EPS and sales on in-line guidance, the stock rose 11.72% in response to earnings on October 29th. That was the company’s third best stock price reaction to earnings since at least 2001.
Seeing as earnings came out at the end of the month, it obviously was not the only factor playing into LEG’s massive October rally. Technicals were also a key factor. The stock had been in a long term downtrend since the summer of 2017, but that trend was broken mid-October headed into earnings. The move on earnings allowed the stock to reach another technical milestone as it took out the previous all-time highs around $50. Since then, the stock has managed to continue its run higher given this catalyst. Month to date, LEG has just about risen another 6%.
Fortunately, this rally has not eaten into the dividend in a detrimental way as LEG still yields 2.94%. That is a larger yield than the S&P 500 as well as the average for other Consumer Discretionary stocks. Adding to the attractiveness, the dividend has historically been safe as the 136 year old company is a Dividend Aristocrat having grown its payout for the past 47 consecutive years. Given the current payout ratio of 54.2% and Net Debt to EBITDA of 3.16, the company should remain capable of paying its shareholders looking forward.

With that said, the recent move has brought the stock to very elevated levels meaning a pullback would provide a preferred entry point. The stock now trades at a premium to its peers at 19.91x earnings compared to the Household Durables industry average of 13.76x. From a more technical perspective, yesterday’s close brought LEG to the most extended level above its 50-day moving average (over 28% above the 50-DMA) in the last 30 years as shown in the first chart below. Additionally, the 14-day RSI helps to show just how strong momentum has been as LEG has hovered around 86 for most of the past week. The last time this indicator was around similar levels was January of 1992. Typically, readings of this indicator over 70, let alone readings over 80, mean shares are very overbought. Overall, in addition to it having an attractive dividend, the technical picture has rapidly improved for LEG over the past month but given how hot the stock has run, some sort of mean reversion should be expected in the near term. Sign up for Bespoke’s “2020” special and get our upcoming Bespoke Report 2020 Market Outlook and Investor Toolkit.

Alphabet’s Invisible Fence
It seems as though any index you look at these days, whether here or around the world, is breaking out to new 52-week highs. One very large stock that hasn’t been quite able to join in the fun is Alphabet (GOOGL). While the stock just barely made a new high last week, it quickly pulled back and failed to break out again this week in a second attempt at the $1,300 level. After a rally of more than 63% from the start of 2017 through the first half of 2018, GOOGL has made multiple unsuccessful attempts at breaking through the $1,300 level for nearly a year and a half now as it digests those prior gains.

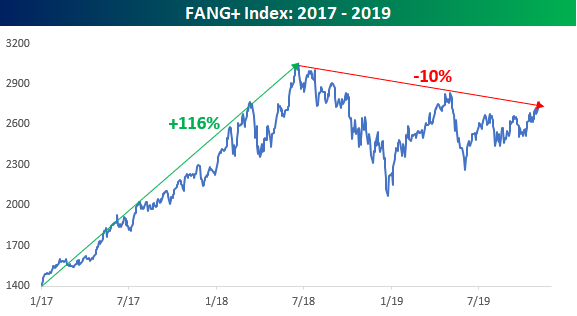
While GOOGL has basically been dead money since the middle of 2018, many of its peers have actually lost money. Remember the FANG+ Index? Back when the FANG trade was at the peak of its popularity, Wall Street naturally wanted to profit on the theme, but because it’s hard to have an ETF or an index of just four stocks, the NYSE created an index of “FANG-like” stocks consisting of other high growth and highly liquid tech companies. Besides the four FANG stocks (Facebook, Amazon, Netflix, and Alphabet), this index also included Alibaba (BABA), Apple (AAPL), Baidu (BIDU), Nvidia (NVDA), Tesla (TSLA), and Twitter (TWTR).
Like GOOGL, the FANG+ index also performed very well from the start of 2017 to its peak in the first half of 2018. While GOOGL rallied 63% during its run, the FANG+ index gained nearly double that at 116%. With the bigger rally, the FANG+ index has had an even tougher time since that peak in the first half of 2018. Not only has the index had a hard time taking out its prior high, but it also hasn’t even tested it. After that peak in June 2018, the FANG+ index declined steadily in the second half of 2018, falling more than 25% and hasn’t even gotten close to its prior highs since. The only thing we can say positively about the index at this point is that after the most recent leg higher, it’s testing (although it hasn’t yet broken through) its downtrend from the June 2018 highs. Until FANG+ can at least break through that downtrend, it’s not exactly an index you want to sink our teeth into. Sign up for Bespoke’s “2020” special and get our upcoming Bespoke Report 2020 Market Outlook and Investor Toolkit.
Fixed Income Weekly – 11/6/19
Searching for ways to better understand the fixed income space or looking for actionable ideas in this asset class? Bespoke’s Fixed Income Weekly provides an update on rates and credit every Wednesday. We start off with a fresh piece of analysis driven by what’s in the headlines or driving the market in a given week. We then provide charts of how US Treasury futures and rates are trading, before moving on to a summary of recent fixed income ETF performance, short-term interest rates including money market funds, and a trade idea. We summarize changes and recent developments for a variety of yield curves (UST, bund, Eurodollar, US breakeven inflation and Bespoke’s Global Yield Curve) before finishing with a review of recent UST yield curve changes, spread changes for major credit products and international bonds, and 1 year return profiles for a cross section of the fixed income world.
In this week’s report we review 2019 returns across fixed income asset classes.

Our Fixed Income Weekly helps investors stay on top of fixed income markets and gain new perspective on the developments in interest rates. You can sign up for a Bespoke research trial below to see this week’s report and everything else Bespoke publishes free for the next two weeks!
Click here and start a 14-day free trial to Bespoke Institutional to see our newest Fixed Income Weekly now!