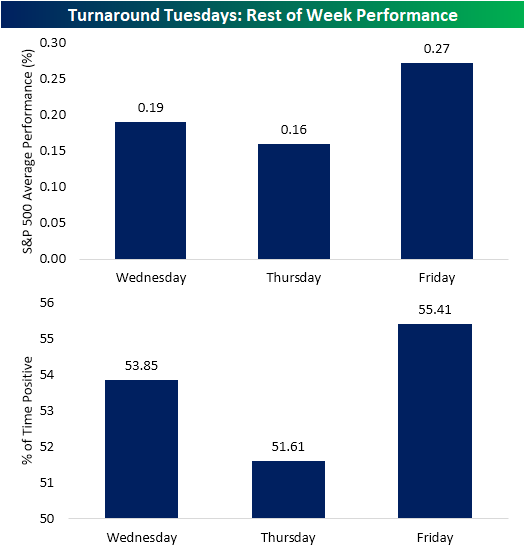
Rest of Week Following Turnaround Tuesdays
As we highlighted in Monday’s Chart of the Day, if there was going to be a gap down of over 1% it could not have come on a better day of the week. After ultimately falling over 1.5% as of Monday’s close, “turnaround Tuesday” was in full effect yesterday with the S&P 500 rallying 1.01%. In the history of the S&P 500, there have been 162 prior instances of a full day decline on Monday of over 1% and a subsequent turnaround Tuesday rally of over 1%. This week was the first such occurrence since August 12th of last year (which was actually a back-to-back week with this type of move) and just the sixteenth occurrence of the past decade. Although the past couple of days’ moves have been substantially larger than what has been the norm in recent months (Monday’s decline snapped a 71 consecutive trading day streak without a 1% up or down move), compared to these 162 other turnaround Tuesdays with 1% or larger moves, the current scenario is actually on the weaker side in terms of volatility. Of those past occurrences, Monday’s average decline was much larger at 2.8% and this week’s rally on Tuesday was not even half the size of the average gain of 2.19% on these prior turnaround Tuesdays.
As for the rest of the week, Wednesdays after turnaround Tuesdays have averaged a full-day gain (from Tuesday’s close to Wednesday’s close) of 0.19% which is 11 bps greater than the average gain of 8 bps for all Wednesdays. Thursday is the weakest day of turnaround Tuesday weeks averaging a gain of only 16 bps with positive price action only 51.61% of the time (average for all Thursdays = 4 bps). Finally, Fridays have typically been the best performing of the three days with an average gain of 27 bps (compared to an average gain of just 5bps for all Fridays). Additionally, it is the day that most consistently has seen the S&P 500 finish higher. Start a two-week free trial to Bespoke Institutional to access our Chart of the Day and every other report and interactive tool we offer.
Bespoke’s Morning Lineup – 1/29/20 – An Apple a Day Keeps the Doctor Away
See what’s driving market performance around the world in today’s Morning Lineup. Bespoke’s Morning Lineup is the best way to start your trading day. Read it now by starting a two-week free trial to Bespoke Premium. CLICK HERE to learn more and start your free trial.

After more than three months without a 1% move in either direction, the S&P 500 has now had back to back daily 1% moves. First Monday with a decline of over 1% and then yesterday with a gain of over 1%. In the S&P’s history, there have only been four prior periods where the index went more than three months without a 1% move and then followed that streak with back to back moves of 1%. Yesterday’s 1% rally, however, was the first time that one of the two days included a 1% move to the upside.
The Closer – Apple Earnings, Market Margins, Manufacturing Activity, CBO – 1/28/20
Log-in here if you’re a member with access to the Closer.
Looking for deeper insight on markets? In tonight’s Closer sent to Bespoke Institutional clients, we review two of the most widely anticipated earnings: Starbucks (SBUX) and Apple (AAPL). We then take a look at the record high price-to-sales ratio for the S&P 500 before turning to today’s manufacturing data. We finish by going over the CBO’s economic forecasts.

See today’s post-market Closer and everything else Bespoke publishes by starting a 14-day free trial to Bespoke Institutional today!
Dividend Stock Spotlight: State Street (STT)
Earlier today we updated our weekly Bespoke Stock Scores database, which takes a “fusion” approach to ranking every stock in the S&P 1500. Each stock gets a fundamental ranking, a technical ranking, and a sentiment ranking. These three scores are then combined to form our overall Stock Score. This week, State Street (SST) came in with the highest overall score for a second week in a row. The company’s current fundamental picture is attractive with a solid valuation relative to its S&P 1500 peers in the Capital Markets industry. The company’s PEG, P/B, P/S, and P/E ratios are all lower than those of similar companies.
In addition to strong fundamentals, State Street’s technicals also played into its high score these past couple weeks. Over the past two years, STT has remained in a downtrend off of its January 2018 highs. But the stock bottomed out in August around $48, finally breaking this downtrend later in the fall. The stock has gone on a significant rally in the time since having risen nearly 60% off of the August low through today. Given this strong run over the past few months, in recent days STT has experienced a bit of mean reversion after reaching extremely overbought levels (over two standard deviations above its 50-DMA). As shown in the chart below, this was the first major pullback for the stock since September/October but it has also provided a more opportune entry point. In fact, the stock currently has a “good” timing score in our Trend Analyzer.
In addition to the high stock score based on these metrics, adding to STT’s attractiveness is a high dividend yield which recent declines in the stock price have lifted to 2.71%. While not the highest yield, it is larger than the 2.27% yield of the overall Financial sector. Given the payout ratio remains very healthy at 29.7%, the company has plenty of room to continue to grow this dividend as it has every year of the past couple of decades outside of the Financial Crisis (2008-2010). Start a two-week free trial to Bespoke Premium to access our research platform, which includes our weekly Stock Scores rankings and much more.

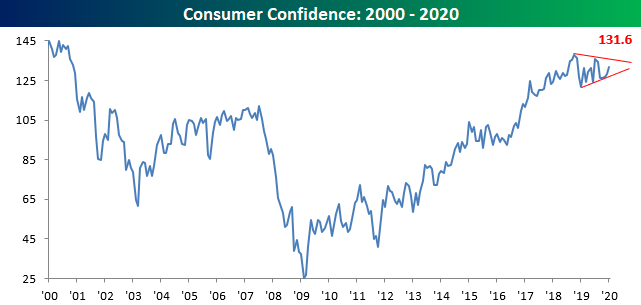
Consumers Still Confident
Today’s report on Consumer Confidence for the month of January came in at 131.6 versus December’s reading of 128.2 and was handily above forecasts for a reading of 128.0. At this level, confidence remains stuck in the narrowing range it has occupied for the last 18 months and well above its historical average of ~95.
Breaking down this morning’s report by Present Situation and Expectations, the wide gap between the two remains well intact and near its widest levels on record. While consumers’ views toward the present are near twenty-year highs, sentiment towards the future has been stuck in a sideways range. For more than three years now, consumers have been expecting their optimistic views of current conditions to deteriorate in the future, but at this point those concerns have never materialized.

One reason the less optimistic outlooks have yet to materialize is that the job market remains strong. Despite some mixed signals towards the end of last year, nearly half of all consumers say jobs are ‘plentiful’ which is near the highest levels on record.

The strong job market is also fueling improved sentiment among the lowest paid US consumers. While sentiment levels have stalled out among consumers with incomes of $35K and above, confidence among consumers with incomes of $15K or less has surged in recent months. In fact, over the last seven months, confidence levels among this income cohort have seen two of their five largest m/m gains on record (January 2020 and July 2019). Start a two-week free trial to Bespoke Institutional for full access to our research and interactive tools.

B.I.G. Tips – Fed Days January 2020
Bespoke Stock Scores — 1/28/20
Chart of the Day: Sentiment Not Yet At Extremes
B.I.G. Tips – Pullbacks All Around
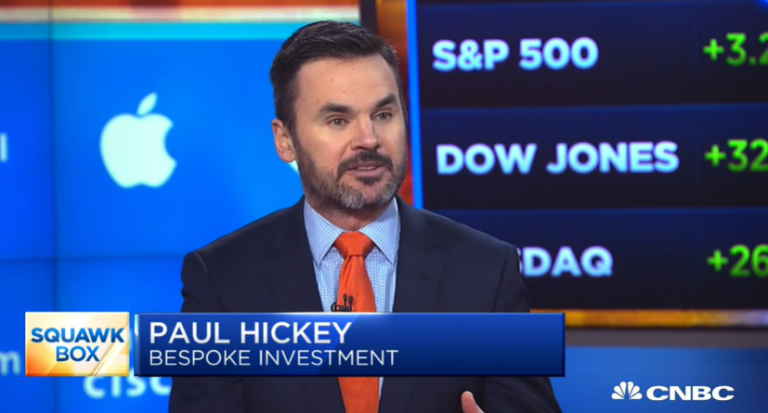
Bespoke CNBC Appearance (1/28/20)
Bespoke co-founder Paul Hickey appeared on CNBC’s Squawk Box today to discuss the upcoming earnings season and trends for stocks reporting. To view the segment, click on the image below.
Start a two-week free trial to Bespoke Institutional for full access to our research and interactive tools.