Leveraged Long ETFs in 2019
While ETFs tend to mirror the performance of the underlying index or asset they are meant to track, leveraged ETFs seek to provide investors and traders the opportunity to experience performance that is a multiple (usually double or triple) of the underlying asset’s performance. For individual investors, though, these types of securities should be approached with extreme caution due to higher costs and excess risks involved. The longer an investor holds these securities, the greater there is a chance for the ETF’s performance to deviate from the performance of the underlying asset. They’re only meant to actually double or triple the underlying security’s performance on a daily basis.
Leveraged ETFs tend to do best in tracking their underlying asset during trending markets as opposed to choppy periods, and with 2019 being a year where the market has, for the most part, traded steadily higher, these leveraged ETFs have performed very well and in many cases lived up to their descriptions. Equities have already performed well this year with the S&P 500 (SPY) having rallied over 27% year-to-date as of yesterday’s close, and that is off of the November 27th highs just a hair under 28%. The UltraPro S&P 500 ETF (UPRO), which is a 3x leveraged ETF, has actually risen 85.6%, which is more than three times the performance of the S&P 500.

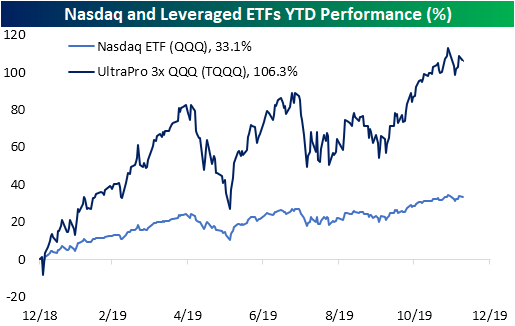
Similarly, the 3x leveraged ETF tracking the Nasdaq 100 – UltraPro QQQ (TQQQ) – has more than doubled so far in 2019! That is also slightly more than three times the performance of the Nasdaq 100 ETF (QQQ).
Small caps, which have lagged their large-cap peers and trended down or sideways for most of the year, are still up 22.6% as measured by the Russell 2000 ETF (IWM). Given the more sideways nature of the underlying index this year, the 2x Ultra Russell 2000 ETF (UWM), which is supposed to double the daily return of the Russell 2000, has come up modestly short of its described goal, gaining 42%. Looking at the chart below, you can see that during periods where the Russell 2000 was trending higher, the index surged, but during periods of sideways trading, it actually declined.

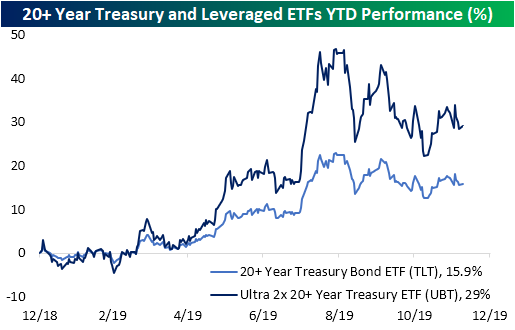
In the Treasuries space, the 2x 20+ Year Treasury ETF has also pretty much doubled the return of the underlying ETF it tracks at 29% vs 15.9%.
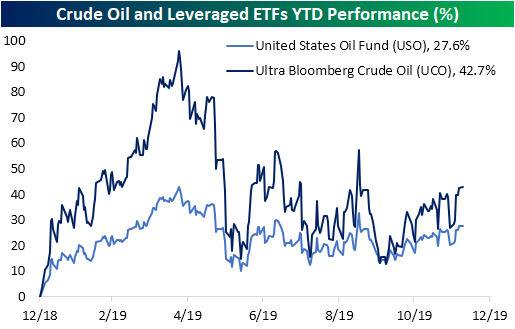
In the commodities space, USO, which is meant to track the price of oil, has risen just under 28%, but the 2x Crude ETF – Ultra Bloomberg Crude Oil (UCO) – which seeks to provide double the daily return of WTI futures – has only returned 1.5 times the return of USO and only 1.4 times the return of the underlying index it is meant to track. Again, UCO and other leveraged products are designed for shorter holding periods (one day in UCO’s case), so factors such as compounding can lead to long-run returns varying from the underlying index.
Additionally, while levered ETFs really juice upside returns on the way up, the opposite also holds true. An investment in the natural gas ETF (UNG) at the start of the year would have been a notable pain trade with a 30% decline YTD. With losses like that, it has been an absolutely brutal year for the triple-levered long natural gas ETF (UGAZ). The only silver lining, if you can call it that, is that while the ETF ‘should’ be down 90%, it’s down ‘only’ 79.6%. Start a two-week free trial to Bespoke Institutional to access our interactive Chart Scanner and Trend Analyzer tracking these ETFs and much more.

B.I.G. Tips – Fed Days December 2019
Bespoke Stock Scores — 12/10/19
2020 Outlook – Housing
Our 2020 Bespoke Report market outlook is the most important piece of research that Bespoke publishes each year. We’ve been publishing our annual outlook piece since the formation of Bespoke in 2007, and it gets better every year! In this year’s edition, we’ll be covering every important topic you can think of that will impact financial markets in 2020.
The 2020 Bespoke Report contains sections like Washington and Markets, Economic Cycles, The Fed, Sector Technicals and Weightings, Stock Market Sentiment, Stock Market Seasonality, Housing, Commodities, and more. We’ll also be publishing a list of our favorite stocks and asset classes for 2020 and beyond.
We’ll be releasing individual sections of the report to subscribers until the full publication is completed by year-end. Today we have published the “Housing” section of the 2020 Bespoke Report, which takes a close look at the state of this key area of the economy and whether strength in 2019 can continue in 2020. Lower interest rates in 2019 helped housing recover from a weak 2018, and there are signs that the strength can continue into 2020. We tell you why in this section.
To view this section immediately and all other sections, become a member with our 2020 Annual Outlook Special!

2020 Outlook – Commodities
Our 2020 Bespoke Report market outlook is the most important piece of research that Bespoke publishes each year. We’ve been publishing our annual outlook piece since the formation of Bespoke in 2007, and it gets better every year! In this year’s edition, we’ll be covering every important topic you can think of that will impact financial markets in 2020.
The 2020 Bespoke Report contains sections like Washington and Markets, Economic Cycles, The Fed, Sector Technicals and Weightings, Stock Market Sentiment, Stock Market Seasonality, Housing, Commodities, and more. We’ll also be publishing a list of our favorite stocks and asset classes for 2020 and beyond.
We’ll be releasing individual sections of the report to subscribers until the full publication is completed by year-end. Today we have published the “Commodities” section of the 2020 Bespoke Report, which focuses on performance and long-term trend shifts of every major commodity.
To view this section immediately and all other sections, become a member with our 2020 Annual Outlook Special!
Chart of the Day – NFIB Small Business Sentiment Suggests No Recession on the Horizon
Bespoke’s Morning Lineup – 12/10/19 – Small Business Sentiment Improving
See what’s driving market performance around the world in today’s Morning Lineup. Bespoke’s Morning Lineup is the best way to start your trading day. Read it now by starting a two-week free trial to Bespoke Premium. CLICK HERE to learn more and start your free trial.

The Closer – Copper Spike, Decile Data, Positioning Pushed – 12/9/19
Log-in here if you’re a member with access to the Closer.
Looking for deeper insight on markets? In tonight’s Closer sent to Bespoke Institutional clients, we begin with a review of copper’s breakout after Friday’s rare 3% rally. Next, we look at what has driven stocks in the US and Europe with a decile analysis based on several factors like leverage, EPS growth, dividend yield, P/E, and more. We finish with Commitment of Traders data showing investors going long crude and short interest rates.

See today’s post-market Closer and everything else Bespoke publishes by starting a 14-day free trial to Bespoke Institutional today!
Bear Market Performance
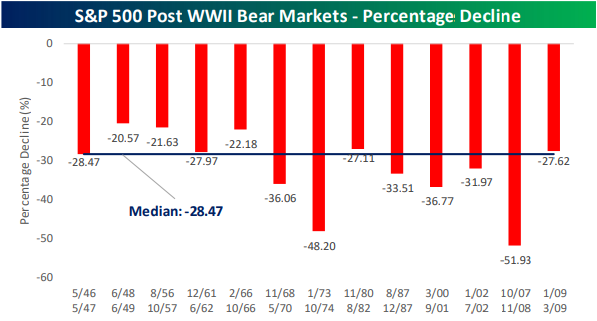
On Friday, we released the first taste of our 2020 outlook report with the Market Cycles and Economic Cycles sections. As the S&P 500 closed at another record high in November (currently just under a quarter of a percent away from this high), the bull market remains fully intact as the picture looks very different from the time of our last end-of-year report when the bull market was on the verge of coming to an end. We define a bull market as any period in which the S&P 500 rallies 20% or more (on a closing basis) without a 20% or larger drawdown. Bear markets, on the other hand, are a 20% decline from a high without a 20% rally in between.
Even though we are far from a bear market (S&P 500 would need to fall to 2522.9 from the November 27th high to meet the criteria), in the Market Cycles section, in addition to gauging where in the cycle we currently stand, we also highlighted equity market performance during bear markets. Of the thirteen post-WWII bear markets, the median decline was closer to 30% (median: -28.47%). The least severe bear market was a 20.6% decline from June 1948 to June 1949, while the most severe was during the credit crisis when the S&P 500 fell close to 52%!
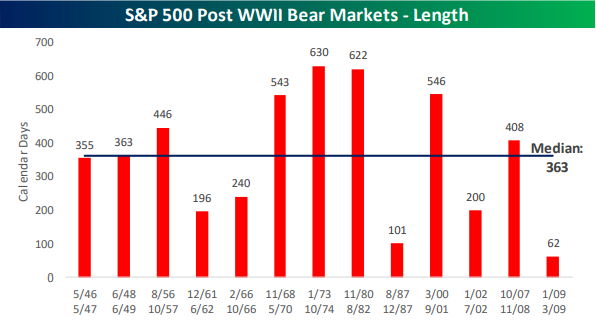
There have been a number of bear markets that have been relatively short (200 days or less), but most tend to be drawn out lasting over a year. The shortest bear market was just 62 days from January 2009 through March 2009, but that was basically just an extension of the prior one from the Credit Crisis. The longest bear market in the post-WWII period was 630 days beginning in January 1973 and ending in October 1974. Sign up using our 2020 Annual Outlook Special to gain access to the entire section on Market Cycles and the full publication to be released by year end.
Mega Cap Exposure By Sector
With all the talk about a potential rotation from large cap stocks to small caps, we wondered which large cap sectors were the most exposed to so-called mega cap stocks i.e., those companies with market capitalizations greater than $100 billion. Within the S&P 500, there are currently 61 stocks meeting the criteria of a mega cap. As you might have guessed, Technology has the largest number of mega cap stocks with 15, followed by Health Care with 12. On the other end of the spectrum, the Real Estate sector doesn’t have a single mega cap, while Materials and Utilities each have one.
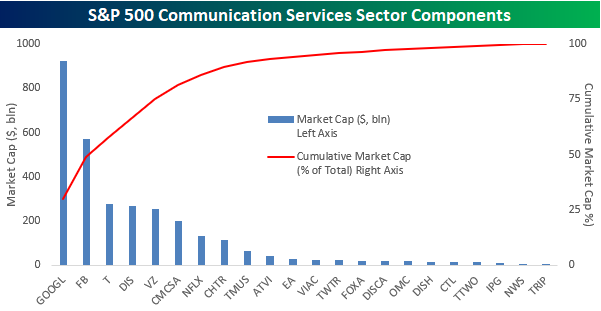
The table below is sorted by sectors that have the greatest exposure to mega cap stocks in terms of the market cap of these stocks as a percentage of the sector’s total market cap. By this measure, Communications Services actually has the greatest exposure with nearly 90% of its market cap coming from stocks with market caps in excess of $100 billion. Behind Communications Services, other sectors with a large exposure to mega caps include Technology, Consumer Staples, and Health Care. If large cap stocks were to fall out of favor, these sectors would likely come under pressure.

In the chart below, the blue bars show the market cap of each stock in the S&P 500 Communication Services sector (left axis) while the red line shows the cumulative market cap of stocks in the sector as a percentage of total market cap. For example, Alphabet’s (GOOGL) $924 billion market cap accounts for 30% of the sector’s total market cap, and then when you add in Facebook (FB), the total market cap of those two stocks accounts for 49% of the sector’s market cap. Moving out further to the right, the top five stocks in the sector account for 75% of the sector’s market cap while the top eight stocks, which each have market caps above $100 billion, account for just under 90% of the sector’s entire market cap. After that, the fourteen remaining stocks in the sector could completely disappear and the impact on the sector wouldn’t be much more than a 10% correction! Start a two-week free trial to Bespoke Institutional to access our research reports, interactive tools, and more.