Don’t Fret About Higher Claims
Fingers were crossed that this week’s initial jobless claims would help to bring some clarity after the past month has seen a couple of low readings and a couple of elevated readings. Unfortunately, that did not happen as claims spiked to their highest level since September of 2017 at 252K. That was a 49K rise from last week and a 38K miss relative to forecasts. That is both the largest WoW increase and the widest miss since September 2017.

Additionally, this massive surge in claims has brought an end to the record streak in which claims have come in at or below 250K. Granted, the streak at or below 300K is still going strong at 249 weeks. That’s nearly five years!

While there was some help from an elevated reading of 227K rolling off of the four week moving average this week, the 252K that replaced it has sent the average 6.25K higher to 224K. That is the largest one week increase since the first week of May when it rose by 7.75K. Similarly, the last time the four week moving average was as high or higher than the current reading was on May 10th when it rose to 225K.

While at first glance this massive increase in the context of relatively flat claims over the past year may seem like a concern, more than likely it all comes down to pure seasonality especially as Thanksgiving arrived later this year. As shown in the chart below, the current week of the year has historically been the most volatile for seasonally adjusted initial jobless claims. The standard deviation for the weekly changes is at 26.98, nearly double the average standard deviation (13.96) for all weeks of the year.

Turning to the non-seasonally adjusted data, claims also rose dramatically totaling 317.5K compared to 216.8K last week. That is the first time NSA claims rose by over 100K in a single week since December 2017. Again, while at first glance, the fact that it was a 56K YoY increase and the highest number for the current week of the year since 2016 may be concerning, it most likely can be chalked up to seasonality around the holidays and a later Thanksgiving.

To emphasize this, we normalized the data around the Thanksgiving holiday. As shown in the charts below, for the NSA data, this year has actually seen a smaller than average spike in the weeks following the holiday when compared to the past decade’s average. And when it comes to the SA number, the seasonal factor used in adjusting the NSA data was larger than average this week. Start a two-week free trial to Bespoke Institutional to access our interactive economic indicators monitor and much more.
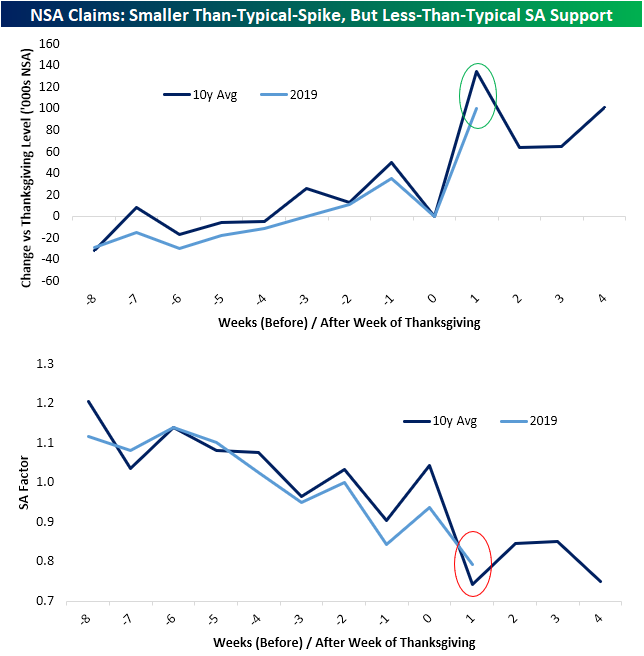
Chart of the Day: PDFSurging As Semis Spending Bottoms Out
The Bespoke 50 Top Growth Stocks — 12/12/19
Every Thursday, Bespoke publishes its “Bespoke 50” list of top growth stocks in the Russell 3,000. Our “Bespoke 50” portfolio is made up of the 50 stocks that fit a proprietary growth screen that we created a number of years ago. Since inception in early 2012, the “Bespoke 50” has beaten the S&P 500 by 115.1 percentage points. Through today, the “Bespoke 50” is up 243.4% since inception versus the S&P 500’s gain of 128.3%. Always remember, though, that past performance is no guarantee of future returns. To view our “Bespoke 50” list of top growth stocks, please start a two-week free trial to either Bespoke Premium or Bespoke Institutional.

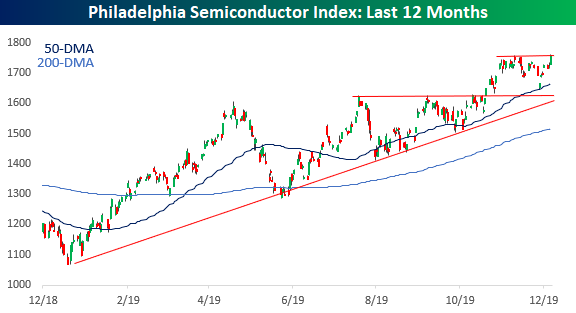
No Quitters in These SOX
With the Philadelphia Semiconductor Index (SOX) up over 50% on the year, there’s more than a bit of skepticism on the part of analysts as to whether the group can keep up the momentum heading into 2020. From early November to the first days of December, those concerns were reflected in the performance of the SOX as it dropped close to 6% and underperformed the broader market by a wide margin. In the last several days, though, the group has seen a strong rebound. Last week, the index broke its downtrend, and now in just the last couple of days, the SOX bounced right off of support at its intraday downtrend.

Impressively, the rebound in the SOX actually propelled the index to a slight new all-time high yesterday. As mentioned above, the rally of the last two days came as the sector bounced right at support from its intraday trendline, but the impetus for the entire rally off the early December lows also coincided with an important support level. As shown in the one-year chart below, in that decline from the November peak, the sellers dried up just as the SOX touched its 50-day moving average (DMA), and once that held, the buyers came rushing in. Start a two-week free trial to Bespoke Institutional to access our 2020 Outlook Report, interactive tools, and much more.
Uniformity, But Dispersion Below the Surface
The image below is from our Trend Analyzer tool and shows the current levels of major US indices relative to their trading ranges. You don’t have to look long to see that there’s currently quite a lot of uniformity in US indices as they are all just into overbought territory. The one outlier, if you can call it that, is the Micro-Cap ETF (IWC), which is just slightly more overbought than everything else.
The Micro-Cap ETF is also leading in terms of performance over the last week with a gain of over 2%, and right behind IWC, four other ETFs have seen gains of over 1%, including the Rusell 2000 (IWM) and Nasdaq 100 (QQQ). While the IWM has been a laggard for much of the year and is playing catch up, QQQ has risen more than any other index gaining over 33%.
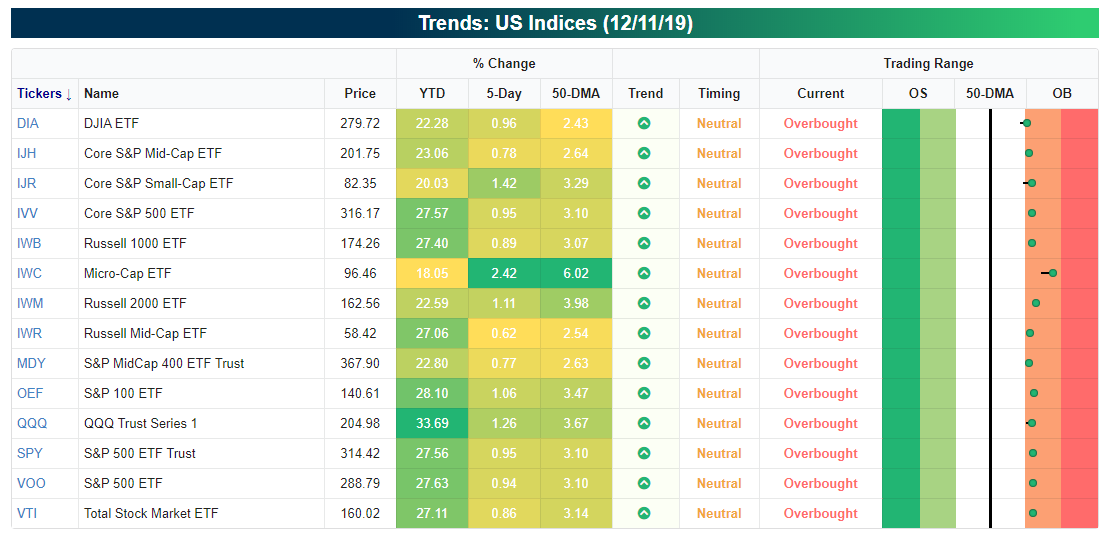
While there has been a lot of uniformity among indices recently, on a sector basis, we have seen a lot more dispersion as five sectors are overbought, five are neutral, and one (Real Estate) is oversold. Technology (XLK) has been a leader over the last week gaining 1.7%, while Materials (XLB), Financials (XLF), Industrials (XLI), and Energy (XLE) are all up over 1%. On the downside, Real Estate (XLRE) is down over 1%, and Utilities (XLU) is down 0.22%. These two sectors are also the only ones below their 50-DMAs as investors have embraced more of a risk-on attitude while shunning defensive, income-oriented sectors. One positive for both sectors? Both currently have “Good” Timing scores in our Trend Analyzer. Start a two-week free trial to Bespoke Institutional to access our 2020 Outlook Report, interactive tools, and much more.

Bespoke’s Morning Lineup – 12/12/19 – Here Come Jobless Claims
See what’s driving market performance around the world in today’s Morning Lineup. Bespoke’s Morning Lineup is the best way to start your trading day. Read it now by starting a two-week free trial to Bespoke Premium. CLICK HERE to learn more and start your free trial.

The Closer – Fed Gives The Green Light For Higher Inflation – 12/11/19
Log-in here if you’re a member with access to the Closer.
Looking for deeper insight on markets? In tonight’s Closer sent to Bespoke Institutional clients, in the wake of the FOMC’s rate decision we recap the market reaction and which assets are poised to gain the most from where policy stands. Given the FOMC’s focus on inflation, we then review recent inflation data including today’s CPI release which was stronger than expected. We also take a look at the federal government budget before finishing with EIA data.

See today’s post-market Closer and everything else Bespoke publishes by starting a 14-day free trial to Bespoke Institutional today!
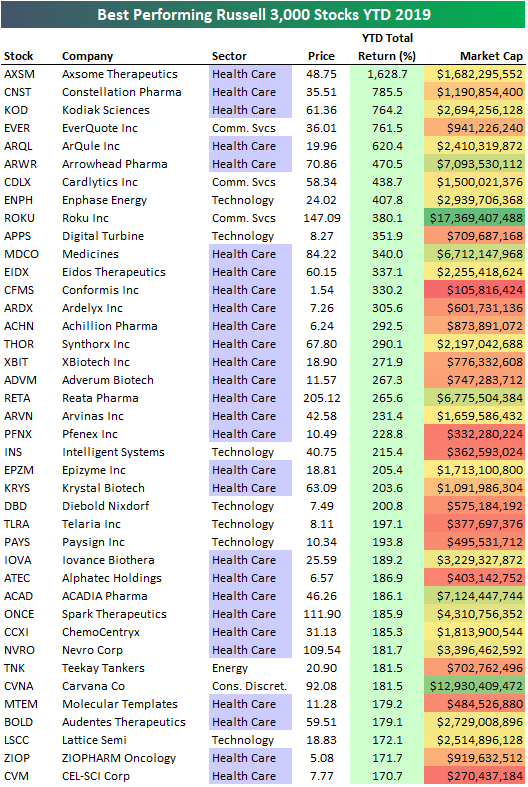
The Best Performing Stocks of 2019
The Russell 3,000 contains US stocks from large-caps to small-caps that account for more than 98% of the market cap of publicly traded US stocks. Below we show the average YTD total return of Russell 3,000 stocks in each sector through the close on December 10th. While the cap-weighted Energy sector of the S&P 500 is up slightly year-to-date, the average US Energy stock across market caps is actually down 10% so far in 2019. On the flip side, the average Technology stock is up 34.5% on the year, which is more than 11 percentage points higher than the average for all stocks in the Russell 3,000. Other sectors that have seen their components outperform the average include Health Care, Real Estate, and Industrials.

Below is a look at the 40 best-performing stocks in the Russell 3,000 so far this year. The top-performing stock is Axsome Therapeutics (AXSM), which has developed a promising narcolepsy drug. AXSM is currently up 1,628.7% in 2019 — more than double the next best performer.
You’ll notice that the large majority of names on the list are biotech companies in the Health Care sector. When biotech is working, this is usually the case. The potential upside for drugs and treatments that ultimately work is enormous, and during up-trending markets when investors are willing to take on risk, small-cap biotechs absolutely fly.
To clean up the list a little, below we show the best performing non-Health Care stocks in the Russell 3,000 year-to-date. EverQuote (EVER) ranks first with a gain of 761.5%, followed by Cardlytics (CDLX), Enphase Energy (ENPH), and Roku (ROKU).
You’ve likely not heard of most of the names on these two lists, but we’d recommend sitting down and researching them just to get a better sense of what’s REALLY been working lately. Sign up using our 2020 Annual Outlook Special to become a Bespoke Premium member today.
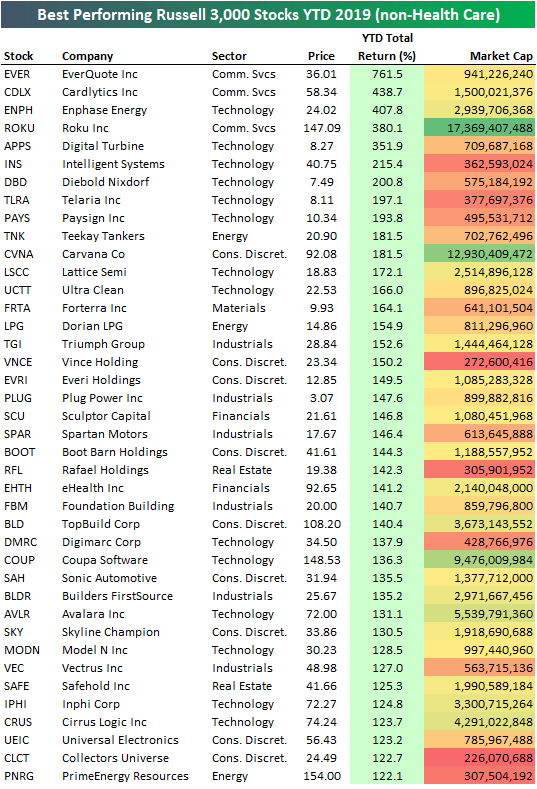
Chart of the Day: Internationals Outperforming in Q4
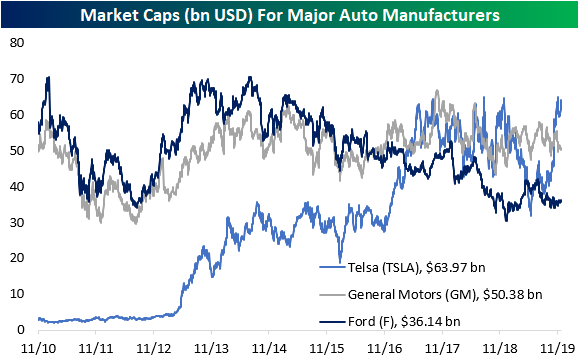
Tesla (TSLA) Once Again The Highest Valued US Auto Maker
In the past year and a half, we have periodically (see here, here, and here) kept tabs on the size of the US’s auto manufacturers: Ford (F), General Motors (GM), and Tesla (TSLA). While on the road you are perhaps more likely to come across a car, truck, or SUV created by Ford or GM, the rookie of the industry, TSLA, actually boasts the largest market cap at the current moment with the company valued at $63.97 billion. That has not been the case all year though. The stock’s downtrend in the first half of 2019 resulted in TSLA spending a brief stint as the automaker with the smallest market cap; falling below that of Ford (F). After bottoming out in June, the stock began to grind higher, breaking out of its downtrend, and ultimately surging over 17.67% the day after earnings in October. It was at this point that TSLA took the crown from GM which currently has a market cap of $50.38 bn. Since then even smashed windows at the Cybertruck reveal only temporarily dampened TSLA as the stock has continued to push higher in the past couple of weeks. Given that, TSLA has further distanced itself from GM and F in terms of market cap with the differences between the companies’ sizes some of the largest on record. In fact, only December of last year saw TSLA’s market cap larger than that of Ford or GM by a wider margin as shown in the second and third charts below. Start a two-week free trial to Bespoke Institutional to access our 2020 Outlook Report, interactive tools, and much more.