Bespoke Stock Scores — 12/17/19
2020 Outlook — Economic Indicators
Our 2020 Bespoke Report market outlook is the most important piece of research that Bespoke publishes each year. We’ve been publishing our annual outlook piece since the formation of Bespoke in 2007, and it gets better every year! In this year’s edition, we’ll be covering every important topic you can think of that will impact financial markets in 2020.
The 2020 Bespoke Report contains sections like Economic Cycles, The Fed, Sector Technicals and Weightings, Stock Market Sentiment, Stock Market Seasonality, Housing, Commodities, and more. We’ll also be publishing a list of our favorite stocks and asset classes for 2020 and beyond.
We’ll be releasing individual sections of the report to subscribers until the full publication is completed by year-end. Today we have published the “Economic Indicators” section of the 2020 Bespoke Report, which looks at long-term trends for 25 major economic releases across various sectors of the economy like manufacturing, inflation, employment, sentiment, and housing.
To view this section immediately and all other sections, become a member with our 2020 Annual Outlook Special!

2020 Outlook — Credit Markets
Our 2020 Bespoke Report market outlook is the most important piece of research that Bespoke publishes each year. We’ve been publishing our annual outlook piece since the formation of Bespoke in 2007, and it gets better every year! In this year’s edition, we’ll be covering every important topic you can think of that will impact financial markets in 2020.
The 2020 Bespoke Report contains sections like Economic Cycles, The Fed, Sector Technicals and Weightings, Stock Market Sentiment, Stock Market Seasonality, Housing, Commodities, and more. We’ll also be publishing a list of our favorite stocks and asset classes for 2020 and beyond.
We’ll be releasing individual sections of the report to subscribers until the full publication is completed by year-end. Today we have published the “Credit Markets” section of the 2020 Bespoke Report, which looks at corporate investment grade and high yield bond spreads and credit default risk levels.
To view this section immediately and all other sections, become a member with our 2020 Annual Outlook Special!
European Stocks Record Breakout
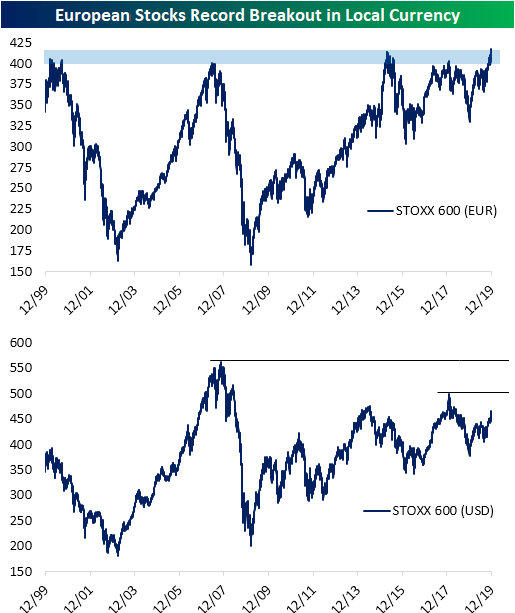
In the final weeks of the decade, equities around the globe have broken out to at least 52 week highs if not record highs as is the case for the S&P 500, and now the Eurozone Stoxx 600.
As shown in the first chart below, the Eurozone Stoxx 600 — priced in local currency (euros) — has finally made a new all-time high. Even as the S&P 500 has more than doubled its pre-Financial Crisis high made in 2007, the Stoxx 600 has just recently managed to take out its 2007 high. And this week the Stoxx 600 has taken out its 2015 high as well, which marks a significant breakout. Notably, though, the 2015 breakout to new highs turned out to be a huge pump fake, and it has taken more than four years to get back to these levels.
While the Stoxx 600 priced in euros has broken out to new highs, it still has a ways to go when priced in dollars (how a US investor in the index has fared). As shown in the second chart below, the Stoxx 600 priced in dollars is still 17.5% below its October 2007 all-time high and 7% below its more recent high from 2018.
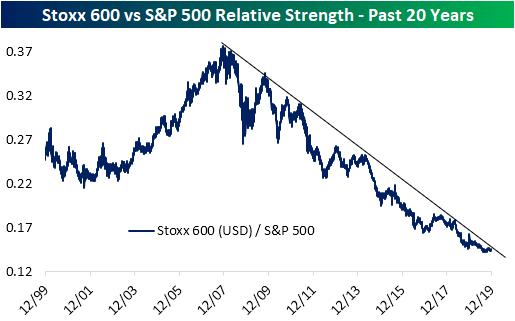
Below is a relative strength chart of the Stoxx 600 (Europe) versus the S&P 500 (US) over the last 20 years. When the line is rising, it indicates European outperformance, while a falling line indicates US outperformance. After outperforming the US for most of the 2000s decade, European stocks have massively underperformed the US for the last 10+ years. When this period of underperformance comes to an end is anyone’s guess, but from a purely mean reversion standpoint, the Eurozone is about as due as it gets! Start a two-week free trial to Bespoke Institutional to access our end of day macro report, The Closer, in addition to numerous other reports and interactive tools.
B.I.G. Tips – Housing’s Foundation Remains Solid
Chart of the Day: A Decade of US Equity Market Dominance
Golden Year for Gold
Last week, we released the Commodities section of our 2020 Outlook report. We highlighted that 2019 has been a mixed year for commodities with plenty of losers and winners. While energy commodities have generally done the best—with the exception of natural gas which has been the biggest loser in the space—gold has been another notable winner having its best year since 2010 with the seventh-best return YTD of the commodities in the Bloomberg Commodity Index. The yellow metal is also just one of four commodities that have delivered a positive total return over the past five years while the broad index has fallen 4.64%.
Similar to other commodities, gold prices are susceptible to long term trends in price movements. The 1970s inflationary episode saw massive increases in prices, before surging real interest rates in the late 1970s and early 1980s drove down gold prices dramatically. After doing almost nothing for the next decade and a half, prices rose almost ten-fold. The post-crisis precious metals collapse cut prices almost in half but have been rising more recently. 2019 saw price sharply increase, especially after taking out the critical multiyear resistance around $1350-$1400. This year, gold has been an almost perfect proxy for short term rates, rising as the Fed got more dovish in the middle of the year before reversing as the Fed ‘s tone also turned around in Q4. Click here to join Bespoke Premium with a special offer and gain access to our full 2020 Outlook report.

Bespoke Morning Lineup — 12/17/19
See what’s driving market performance around the world in today’s Morning Lineup. Bespoke’s Morning Lineup is the best way to start your trading day. Read it now by starting a two-week free trial to Bespoke Premium. CLICK HERE to learn more and start your free trial.

The Closer – International Flows, Europe Record Highs, Internationals, PMIs – 12/16/19
Log-in here if you’re a member with access to the Closer.
Looking for deeper insight on markets? In tonight’s Closer sent to Bespoke Institutional clients, we provide an update on international fund flows, highlight a breakout for European equity indices, and show how stocks with heavy international revenue exposure are outperforming since the latest trade deal was announced.

See today’s post-market Closer and everything else Bespoke publishes by starting a 14-day free trial to Bespoke Institutional today!
2020 Outlook – Yield Curve & Fed
Our 2020 Bespoke Report market outlook is the most important piece of research that Bespoke publishes each year. We’ve been publishing our annual outlook piece since the formation of Bespoke in 2007, and it gets better every year! In this year’s edition, we’ll be covering every important topic you can think of that will impact financial markets in 2020.
The 2020 Bespoke Report contains sections like Economic Cycles, The Fed, Sector Technicals and Weightings, Stock Market Sentiment, Stock Market Seasonality, Housing, Commodities, and more. We’ll also be publishing a list of our favorite stocks and asset classes for 2020 and beyond.
We’ll be releasing individual sections of the report to subscribers until the full publication is completed by year-end. Today we have published the “Yield Curve & Fed” section of the 2020 Bespoke Report, which looks at the slope of the yield curve, inversions, and Fed rate policy heading into 2020.
To view this section immediately and all other sections, become a member with our 2020 Annual Outlook Special!