Bespoke Stock Scores — 5/31/19
Next Week’s Economic Indicators – 5/31/19
This week’s economic data came in split down the middle with 12 releases coming in worse than the prior period or estimates and another 12 improving. A remaining 3 met expectations or were unchanged from the previous period. We noted this same pattern in our Matrix of Economic Indicators for April. The FHFA’s House Price Purchase Index for the first quarter was the first release of a shortened week coming in unchanged from the previous quarter at 1.1%. Monthly FHFA and Case-Shiller prices also came out on Tuesday with both showing slower home price growth. Later that morning the Conference Board’s readings on Consumer Confidence came in stronger than both forecasts and the April reading. The final release Tuesday, the Dallas Fed’s Manufacturing Activity, disappointed at -5.3 versus expectations of 6.2. On Wednesday, the Richmond Fed’s Manufacturing Activity index also came in below expectations but was stronger than the April reading. The second release of Q1 GDP was revised lower but less than expected with growth for Q1 now sitting at 3.1% QoQ SAAR. While consumption growth was stronger, that came thanks in part to inflation measures falling below estimates. Retail and Inventories grew more than expected in April as seen in their Thursday release. Pending home sales were also notably weak. Friday data was better with Personal Income and Spending numbers both beating estimates. Michigan Sentiment was the final release of the week with a reading of 100.0 versus forecasts of 101.5, both below the 102.4 reported in preliminary data.
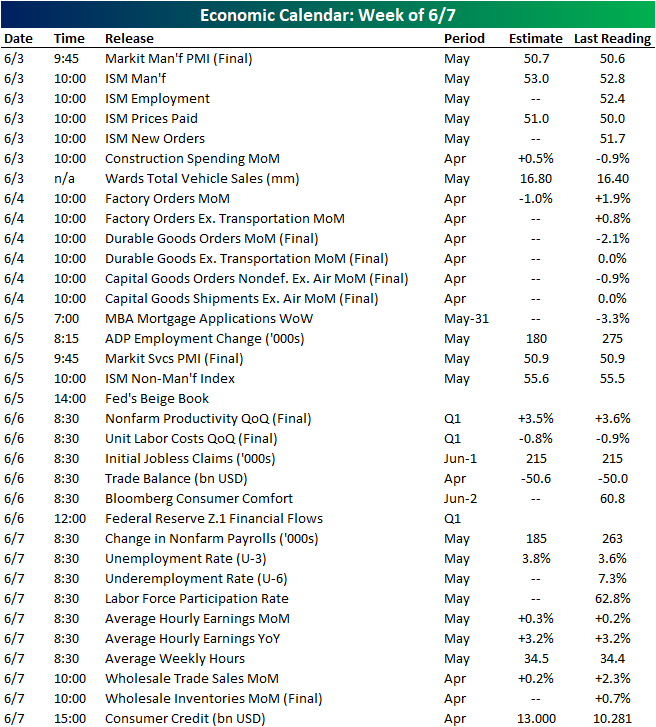
With 34 releases, the data slate picks up next week. Monday we will get some important manufacturing data including the final data for May for the Markit PMI and ISM Manufacturing. Revisions for durable goods and the broader factory orders numbers for April will follow up on Tuesday. As next week is the first week of June, on Wednesday ADP will release their employment data for the month of May. This is expected to show fewer jobs created than April. The service portions of Markit PMIs and ISM will also come out Wednesday morning. In addition to the usual Thursday weekly releases, Nonfarm Productivity and Unit Labor Costs for the first quarter are expected. The Employment Situation Report with its Nonfarm Payrolls number will round out the week in economic data on Friday morning.
Bespoke Market Calendar — June 2019
Please click the image below to view our June 2019 market calendar. This calendar includes the S&P 500’s average percentage change and average intraday chart pattern for each trading day during the upcoming month. It also includes market holidays and options expiration dates plus the dates of key economic indicator releases. Start a two-week free trial to one of Bespoke’s three premium research levels.
Bespoke Matrix of Economic Indicators – 5/31/19
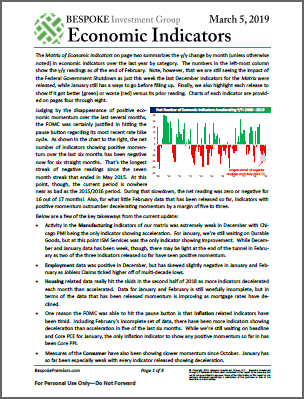
Our Matrix of Economic Indicators is the perfect summary analysis of the US economy. We combine trends across the dozens and dozens of economic indicators in various categories like manufacturing, employment, housing, the consumer, and inflation to provide a directional overview of the economy.
To access our newest Matrix of Economic Indicators, start a two-week free trial to either Bespoke Premium or Bespoke Institutional now!
DJIA Six Week Losing Streaks
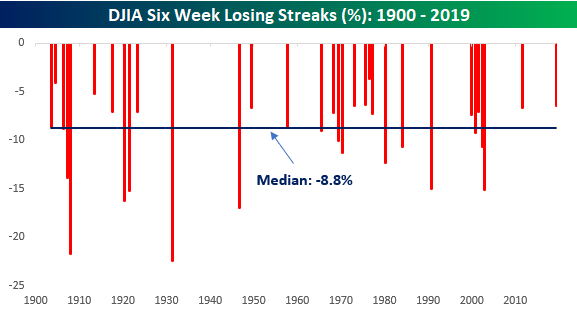
Barring a 700+ point rally into the close (hey, anything is possible), the DJIA is on pace for its first six-week losing streak since June 2011 and the 32nd such streak going back to 1900. As of this writing, the DJIA is down 6.46% over the course of this current losing streak, which would go down as the mildest six-week losing streak for the index since June 1976 and the fifth ‘mildest’ six-week losing streak on record. The chart below highlights each of the DJIA’s prior six-week losing streaks since 1900 and shows how much the index declined during each one of them. Start a two-week free trial to Bespoke Institutional to access all of our research and interactive tools.
While there have been quite a few six-week losing streaks for the DJIA in its history, it is not common for them to go on into a seventh week. As shown in the chart below, just seven of the DJIA’s 32 prior six-week losing streaks have last seven or more weeks, and a 7-week losing streak stretching to an eighth week is practically unheard of with just one way back in 1923.
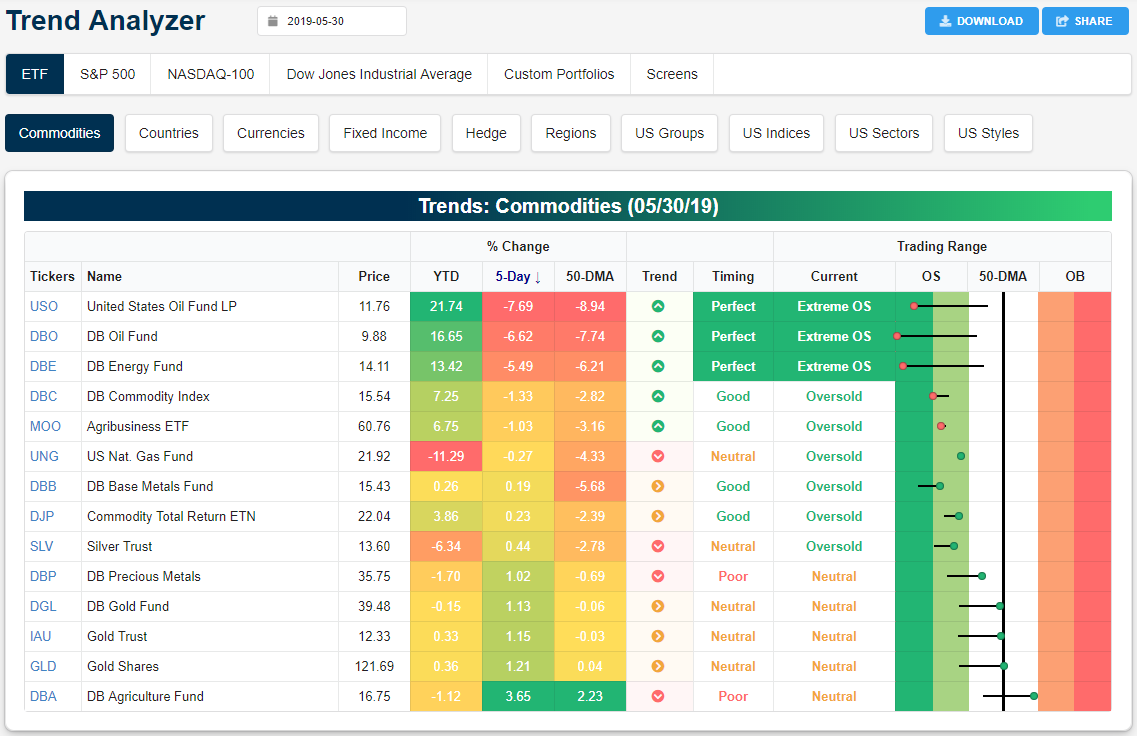
Trend Analyzer – 5/31/19 – Oil Oversold, Metals Move Higher
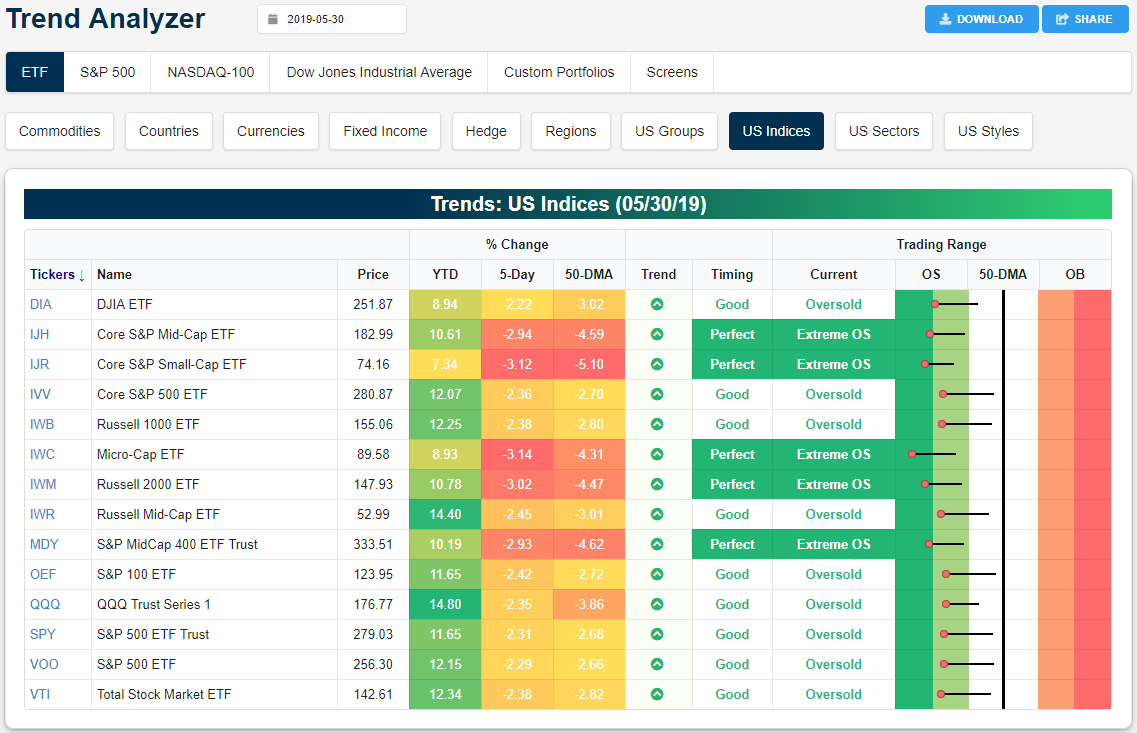
We mentioned yesterday that half of the major index ETFs were sitting at extremely oversold levels at the start of trading yesterday. Small gains helped to at least lift some of these ETFs off of these levels, but a sizeable gap lower at today’s open brought them right back—if not to a greater degree—into oversold territory. While every major index ETF is sitting on a loss over the past week, small and mid-caps have been handily underperforming. These also are all the ones that are still extremely oversold. The Core S&P Small-Cap ETF (IJR) has seen the worst of these declines down 3.8%. This has also tanked gains for the year as it now has the lowest YTD gain of the group. Start a two-week free trial to Bespoke Institutional to access our interactive economic indicators monitor and much more.
Peeking at commodities, similar to equities, oil has been taking it on the chin. Yesterday alone, in spite of supply data that would have indicated stronger prices, WTI crude futures fell just under 4.5% adding to its second straight week of declines; a total decline of 12.95% in that time. On these declines, Oil ETFs (USO and DBO) and the Energy fund (DBE) have all reached extreme oversold levels whereas they were neutral last week.
Conversely, precious metals ETFs have not been shaken by headlines of China raising tariffs on these commodities. The Precious Metals ETF (DBP) in addition to each of the gold ETFs (GLD, DGL, and IAU) have been some of the best performing commodity ETFs this week. The gold ETFs are hovering just under a half of a percent gain and DBP has seen a bit weaker performance gaining 0.23%. While these have been outperforming most commodities, the Agriculture Fund (DBA) has been doing so to an even greater degree with more than quadruple the gains of the next best performer, Gold Trust (IAU). This move has brought DBA towards the upper end of its long term and persistent downtrend channel. This also means DBA is just outside of overbought territory as well.
Brazil Rallies
After a very poor start to the month, Brazilian equities have been quietly salvaging things in the second half of May as the iShares Brazil ETF (EWZ) is on pace for its second straight week of 5% gains and is even up slightly in early trading today. After trading down as much as 10.6% MTD at the recent lows, EWZ has erased all of its losses and finished the day Thursday with a slight gain on the month.
Since the EWZ ETF began trading back in 2000, the current string of back to back weekly gains marks just the eleventh time that the ETF has rallied more than 5% for two straight weeks. The most recent occurrence was back in October 2018, while the one before that was in late 2016. If you’re a bull on Brazil, the last two weeks should have you feeling good. Not only have Brazilian equities erased all of their May declines, but as shown in the chart below, prior occurrences typically haven’t marked short-term peaks. Besides the first occurrence in early 2001 and an occurrence in early 2014, prior streaks generally took place during uptrending periods for the ETF or in the case of the 2015 occurrence, very late in a decline. Start a two-week free trial to Bespoke Institutional to access all of our research and interactive tools.
Morning Lineup – “You Get a Tariff. You Get a Tariff. You Get a Tariff.”
The good news? In less than 7.5 hours it will be all over and the weak equity performance for the month of May will be nothing more than a bad memory. We can only hope that June doesn’t provide any sort of meaningful encore.
One of the catalysts for this morning’s weakness is – you guessed it – tariffs. But this time the tariffs have nothing to do with China. Instead, it’s Mexico, as the Trump Administration announced that that it will enact new tariffs on imports if the country doesn’t do anything to stem the flow of illegal immigrants into the US. At the rate things are going, it won’t be long until the list of countries we aren’t threatening with tariffs will be shorter than the list of countries who we are threatening (or maybe it already is).
Besides the tariff announcements with Mexico, other news pressuring equities this morning include a weaker than expected Manufacturing PMI in China (49.4 vs 49.9) and weaker than expected Retail Sales in Germany. The latter has pushed the yield on the 10-year German bund down to a record low of negative 0.205%. Over here in the US, the 10-year yield has sunk to 2.16%, and the yield curve has further inverted to a new low of negative 17 basis points.
Please click the link below to read today’s Bespoke Morning Lineup for more of our thoughts on the latest tariff announcements. Also, make sure to check out our latest B.I.G. Tips report for a recap of prior down opens to end the month.
With the weak economic data across the globe, markets are increasingly betting that the FOMC will be forced to cut rates at some point in the near future. Between now and January, the futures market is pricing in a 94% chance of at least one rate cut. Even more surprising is that the market is pricing in better than a 37% chance that the Fed Funds rate will be cut by at least 75 bps! At some point, push has to come to shove. Will the market bend to the FOMC’s view or will it be the other way around.

Start a two-week free trial to Bespoke Premium to see today’s full Morning Lineup report. You’ll receive it in your inbox each morning an hour before the open to get your trading day started.

