The Bespoke 50 Top Growth Stocks — 1/9/20
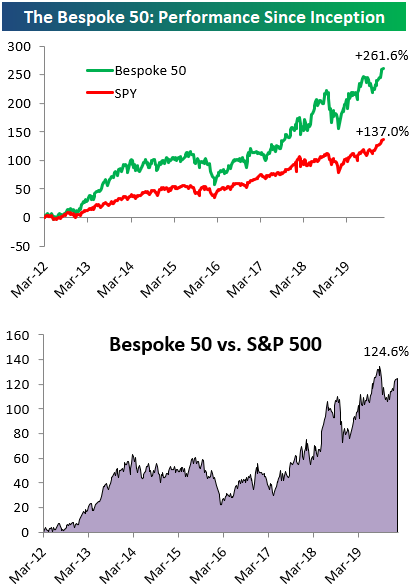
Every Thursday, Bespoke publishes its “Bespoke 50” list of top growth stocks in the Russell 3,000. Our “Bespoke 50” portfolio is made up of the 50 stocks that fit a proprietary growth screen that we created a number of years ago. Since inception in early 2012, the “Bespoke 50” has beaten the S&P 500 by 124.6 percentage points. Through today, the “Bespoke 50” is up 261.6% since inception versus the S&P 500’s gain of 137.0%. Always remember, though, that past performance is no guarantee of future returns. To view our “Bespoke 50” list of top growth stocks, please start a two-week free trial to either Bespoke Premium or Bespoke Institutional.
Tesla (TSLA) Larger Than Ford (F) and General Motors (GM) Combined
Although the stock is down today following a number of analyst downgrades, Tesla (TSLA) has seen a significant run-up over the past several months and between record deliveries that topped expectations and announcing the introduction of its cars and Gigafactory in China the company has already had an eventful 2020. Since the start of the fourth quarter of 2019, TSLA has far outperformed other US automakers. In fact, while Ford (F) is only up 0.49% and General Motors (GM) is down 7.66%, Tesla has doubled. Yesterday, the stock nearly joined a baker’s dozen of other S&P 500 stocks priced at $500 or more.

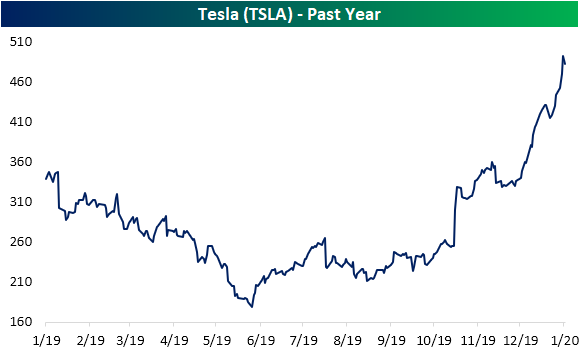
Those are not the only milestones though. About one month ago, we had highlighted that the market cap of TSLA had distanced itself from those of Ford (F) and GM (GM) by some of the widest margins on record. With the stock surging further since then, TSLA is now valued at $86.9 billion. That makes the company not only the largest US automaker by market cap, but it is also about $1 billion larger than the combined market caps of Ford ($36.5 bn) and GM ($49.5 bn). Of other global automakers, only Volkswagen has a larger dollar-adjusted market cap of $98.26 billion while TSLA is still dwarfed by Toyota which has a market cap of $226.96 bn. Start a two-week free trial to Bespoke Institutional to access our interactive economic indicators monitor and much more.

Sentiment Moderates
Over the past week, mounting geopolitical tensions have kept markets on their toes. As of today, equity markets have recovered whatever losses there were, but sentiment has still taken a hit. The percentage of bullish investors in the weekly AAII survey has fallen for a third straight week down to 33.07%. This is the lowest level of bullish sentiment since the first week of December when 31.72% of respondents were bullish. Granted, these declines have not brought bullish sentiment to any sort of extremely low level. In fact, it is now just about in line with the average reading of the past year, 33.41%. If anything, this move appears to be mean reversion as bullish sentiment headed into 2020 had actually gotten pretty extended as we had highlighted in our Pros and Cons report last week.
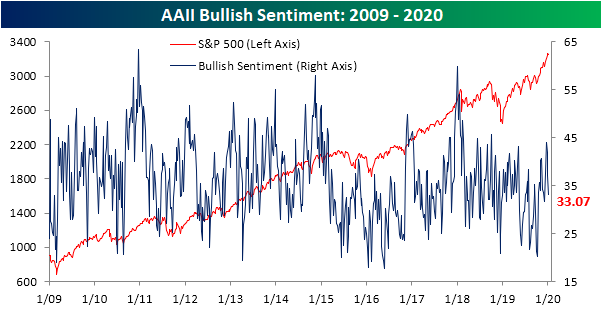
While most of the decline in bullish sentiment in last week’s survey went toward neutral sentiment, this week’s results showed that investors were more firmly bearish borrowing from both the bullish and neutral camps. Nearly 30% of investors reported as bearish this week which was an 8.01 percentage point increase from last week. That marked the third-largest one week jump in bearish sentiment of the past year. Granted, this increase was also about a third and half the size, respectively, of the past two larger increases of 24.14 percentage points in August and 16.11 percentage points in May. Despite the relatively large move higher, bearish sentiment is now right in line with its average of 30.3% over the past year.

As previously mentioned, the gain in bearish sentiment took from those previously reporting as neutral. After reaching 40.91% last week, the highest level since Apri, neutral sentiment has moderated falling down to 37.04%.Start a two-week free trial to Bespoke Institutional to access our interactive economic indicators monitor and much more.

Chart of the Day: Gold Soars, Especially Abroad
Claims Back to Normal
Initial jobless claims for this week were forecasted to come in slightly lower at 220K from last week’s print of 222K. The actual decline was even larger with claims coming in at 214K and last week’s number was revised up by 1K. Claims have now essentially reversed the massive spike observed around Thanksgiving and are back within the range that has been in place for most of the past year. Although we were hesitant to take November’s spike up to 252K at face value (which have still not experienced any revision), the four-week streak of declines from these levels has marked the longest streak of weeks with consecutive declines since a five-week streak that came to a close in April of last year. Additionally, the 38K decline off of that 252K peak has marked the largest four week decline for claims since September of 2017 when they had fallen 43K from 300K to 257K (second chart below).
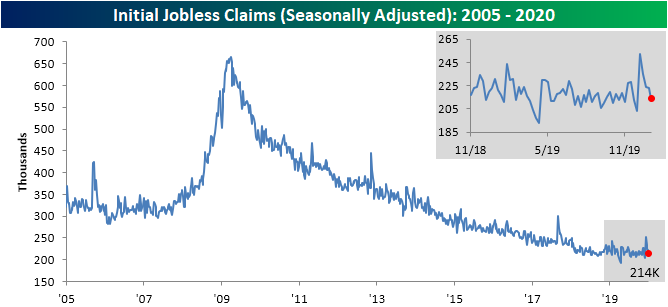

Although the four-week moving average is helpful in smoothing out the week to week fluctuations in claims data, the outlier of 252K several weeks ago has had an effect on elevating the average in recent weeks. This week, that high print has rolled off the average, and the moving average has finally declined week-over-week for the first time since November. After reaching a 52-week high of 233.5K last week, the moving average has fallen 9.5k to 224K. That is the largest one week decline in the moving average since September of 2017 when it had fallen 10.75K. While that is a drastic improvement from where things have been, the average is still somewhat elevated relative to where it has been over the past year.

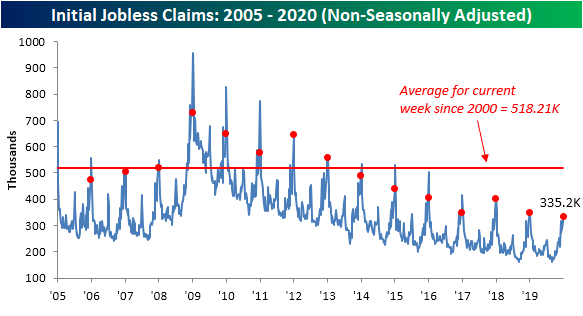
The non-seasonally adjusted data is echoing this as this week’s print shows a still strong labor market. The first or second week of the year has marked the seasonal peak for non-adjusted claims just about every year of the past two decades. So while claims by this measure rose to 335.2K due to seasonal factors, and assuming a higher peak does not get put in place next week, this year’s high would be 15.7K lower than last year’s peak of 350.9K. Although this isn’t as much of an improvement as we’ve seen in prior years (second chart), we’re working with a much lower base now than we were in years past. Start a two-week free trial to Bespoke Institutional to access our interactive economic indicators monitor and much more.

Bespoke’s Morning Lineup – 1/9/20 – Rally Rolls On
See what’s driving market performance around the world in today’s Morning Lineup. Bespoke’s Morning Lineup is the best way to start your trading day. Read it now by starting a two-week free trial to Bespoke Premium. CLICK HERE to learn more and start your free trial.

We’ve been discussing oil a lot recently, but that’s because recent moves in the commodity have been bananas. Yesterday, we saw prices rally more than 4% from Tuesday’s close only to finish the day down more than 4%. Even for a volatile commodity like crude oil, moves of that magnitude don’t occur very often. In today’s Morning Lineup, we also took at look at how crude has performed going forward following prior intraday reversals of similar magnitude.

The Closer – Slipping On Oil, CFO’s Fired Up, European Groups – 1/8/20
Log-in here if you’re a member with access to the Closer.
Looking for deeper insight on markets? In tonight’s Closer sent to Bespoke Institutional clients, we take a look at the massive intraday reversal off of session highs for crude oil and what this means for the commodity and the Energy sector going forward. We also recap today’s EIA petroleum stockpile data. Next, we review the first 10 year Treasury note auction of the year. We then show how the C-suite has become more optimistic through the Duke CFO survey before closing things out with relative performance charts form Europe.

See today’s post-market Closer and everything else Bespoke publishes by starting a 14-day free trial to Bespoke Institutional today!
Markets Gone Wild
Today’s reversals in the financial markets were really the types of moves that don’t come around too often. Exhibit 1 is gold. After rallying more than 2.5% from Tuesday’s close, gold hit a 52-week high only to reverse lower throughout the trading day. As we type this, it’s now down over 1% from Tuesday’s close. Going all the way back to 1980, there have only been six other days where gold rallied more than 1% to a 52-week high only to finish the day down over 1%.

The swing in crude oil was even larger. Earlier in the day, WTI was up over 4% relative to Tuesday’s close. Do you know where it finished? Down over 4%! All in all, WTI traded in a range of 9.9%. How’s that for a volatile session? Start a two-week free trial to Bespoke Institutional to access our Chart of the Day, full coverage of earnings season, and so much more.

Chart of the Day: Triple Plays Heading Into Earnings Season
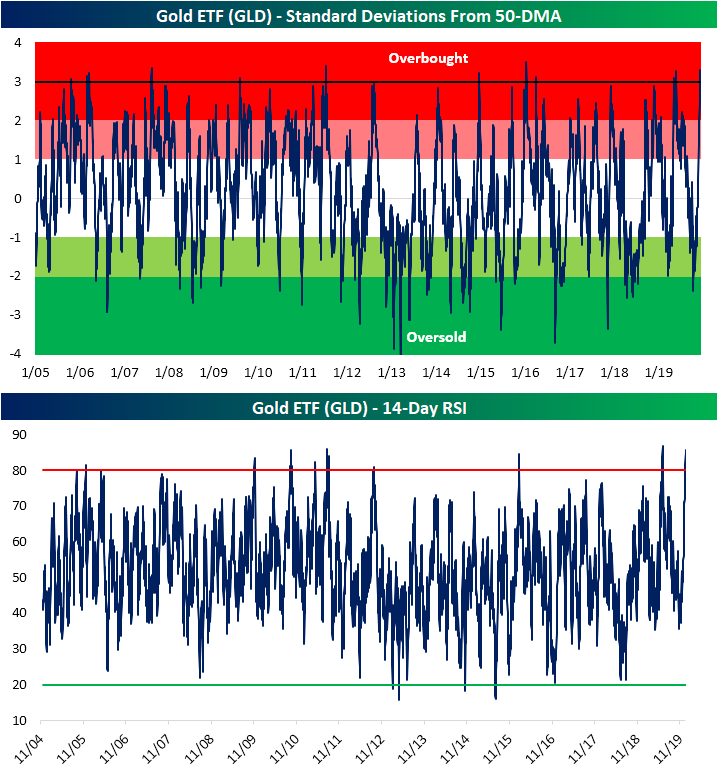
Gold Breaks Out Again But Will It Hold?
At the end of December, we highlighted in a Chart of the Day that gold was entering 2020 with a bullish technical backdrop. After sitting in a downtrend since its peak set in early September, GLD had begun to break out on December 23rd. Since then it has rallied 5.7% fueled by a shift towards safe-haven assets as geopolitical tensions have built with the Middle East. In the past few days, GLD has experienced yet another breakout taking out the September 4th closing high of $146.66.

Although it has held above these levels so far, the rapid rise of the yellow metal in the past few weeks has led it to be extremely overbought by multiple measures. This means there is likely to be some form of mean reversion in the near future testing the sustainability of the most recent breakout. As shown in the chart below, yesterday’s close over a dollar above the September high has led GLD to now sit over 3 standard deviations above its 50-DMA. That is the first time it has done so since June, and before that, you would have to go all the way back to April 2016 to find a time GLD was as extended by that measure.
Similarly, another overbought/oversold indicator, the 14-day RSI, is echoing the extreme readings. While readings above 70 typically indicate that an asset is running hot, the current reading is now over 85! While there have only been a handful of times since the ETF first began trading that the RSI has tipped above 80, readings above 85 are even rarer. Similar to the price in regards to the 50-DMA, the last time things got this extended were in June of 2019. Prior to that, there have only been two other times the RSI has been 85 or greater: once in 2010 and again in 2011. Start a two-week free trial to Bespoke Institutional to access our Chart of the Day, Trend Analyzer tool, and much more.