Bespoke’s Morning Lineup – 3/13/20 – Limit Up (For Now)
See what’s driving market performance around the world in today’s Morning Lineup. Bespoke’s Morning Lineup is the best way to start your trading day. Read it now by starting a two-week free trial to Bespoke Premium. CLICK HERE to learn more and start your free trial.
These days any discussion of levels in the financial markets warrants the qualifier ‘for now’. With that in mind, US equity futures are trading limit up (5%) on optimism that the FOMC will continue to pump liquidity into financial markets, Washington is going to act regarding emergency measures to limit the economic impact, and maybe even that testing will become more widespread. We’re not out of the woods yet, and the headlines are going to get worse, but at some point the market will be able to look through that. Just to give you an idea of how volatile the overnight session was, futures have basically traded in a range of 9%.
Read today’s Bespoke Morning Lineup for a discussion of the carnage in financial markets overnight and the latest tallies on Covid-19 cases.

You’re probably getting sick of charts showing how extreme the moves we have seen in financial markets over the last month have been, but the move in high yield spreads has only been seen at one other time in the last twenty years. In short, when spreads rise it indicates increased risk aversion on the part of investors. In the last four weeks, spreads have increased 386 basis points (bps) or nearly four percentage points. The only time we saw that rapid an increase was at the height of the financial crisis in October 2008.

The Closer – Thursday Thrashing: Fifth-Worst Day for Stocks of All-Time – 3/12/20
Log-in here if you’re a member with access to the Closer.
Looking for deeper insight on markets? In tonight’s Closer sent to Bespoke Institutional clients, after the S&P 500 experienced one of its worst days on record we take a look at some of the other extremes in markets both in the US and abroad. Next, we show some broken aspects of fixed income markets including airline bonds and mortgages. We finish with a look at the declines in Brazil and Canada.

See today’s post-market Closer and everything else Bespoke publishes by starting a 14-day free trial to Bespoke Institutional today!
Bespoke’s Sector Snapshot — 3/12/20
BIG Tips – Municipal Bond Fund Discounts
S&P 500 Recession Script
Sentiment Sours
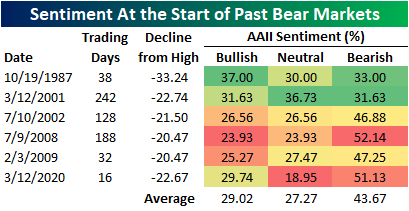
With equities entering bear market territory this week, current sentiment understandably holds a significant bearish bias. Bullish sentiment fell 9 percentage points to 29.74%. While low, sentiment was actually lower as recently as October, August, and the spring of last year.

While that means there is precedent for bullish sentiment to fall even further, the current level is pretty much right in line with what could be expected at the start of an S&P 500 bear market. In the table below, we show the AAII sentiment readings at the start of all bear markets (20% drawdown from a prior high where the rally was at least 20%) since the survey began in 1987 as well as the degree of those declines and the time it took to reach that 20% threshold. The current reading on bullish sentiment is pretty much right in line with the average of past bear markets. Meanwhile, bearish sentiment is at 51.13% which is its highest level for when the S&P 500 reached the threshold for a bear market behind only July of 2008. Neutral sentiment (18.95%) is now at its lowest level since December of 2018 at 18.95% and of the past bear markets, this is the lowest reading.
For just the 56th time since the beginning of the survey in 1987, over half of the respondents reported as pessimistic. Bearish sentiment rose 11.49 percentage points from 39.64% to 51.13%. That 11.49 percentage point jump is in fact large, in the 96th percentile of the past decade’s readings, but as recently as the end of January there was a bigger one week increase of 12.09 percentage points. This leaves bearish sentiment at its highest level since April of 2013 when bearish sentiment reached 54.48%
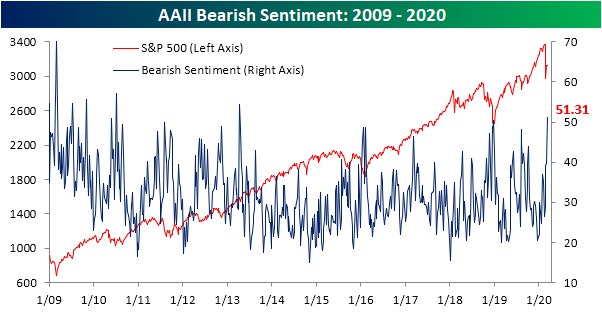
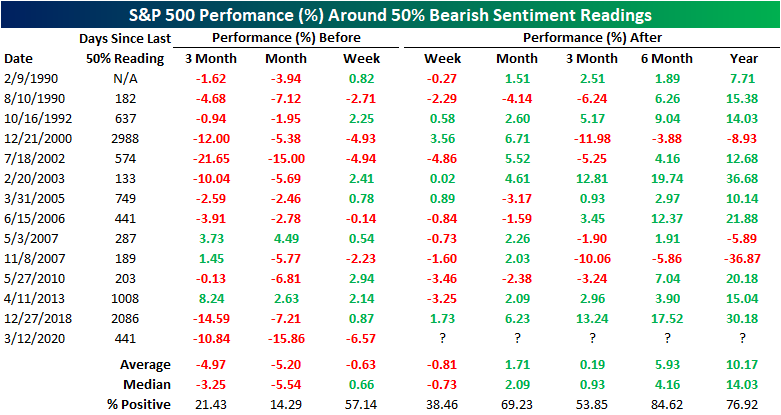
Readings above 50 have been few and far between with only 56 other prior instances in the history of AAII’s survey. The last time we saw a reading this high was was 441 calendar days ago in December of 2018. The table below shows all of the prior times that bearish sentiment tipped above 50% without having done so in the previous 6 months and the S&P 500’s performance around these times. As could be expected, the S&P 500 was typically heading lower in the weeks and months leading up to these elevated bearish readings. Going forward, performance has tended to remain weak over the following week, but begins to improve over the course of the next year. Start a two-week free trial to Bespoke Institutional to access our interactive economic indicators monitor and much more.
Selloff Erases All of US Market Cap Gains Since Election Day 2016
With the US stock market down nearly 7% yet again today, the total market cap of US companies as measured by the Russell 3,000 has fallen $11.5 trillion in less than a month. On February 19th, total US market cap was just over $35 trillion. It’s at $23.8 trillion as of this morning.
What makes this drop even more noteworthy is that $23.8 trillion was the market cap of US companies on Election Day 2016. At this point in time, all of the market cap gains seen since President Trump’s election victory have been wiped out. Visit our membership options page to learn more about Bespoke’s research.

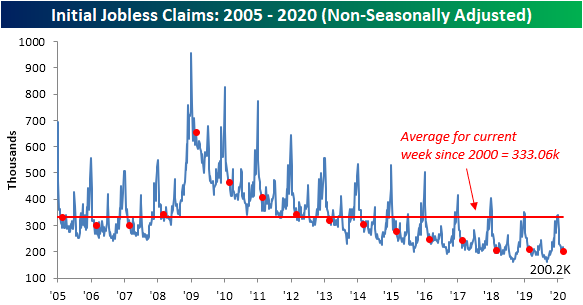
Covid-19 Still Not Showing in Claims
Given its more backward-looking nature, economic data has taken a backseat over the past few weeks, but this also makes more timely data like weekly jobless claims ever more important. While risk assets continue to get hammered, weekly jobless claims have still yet to show any major layoffs as a result of the coronavirus. In fact, claims were lower this week, falling to 211K compared to estimates of an increase to 220K. Last week’s number was also revised lower by 1K (from 216K to 215K). While there still has not been any new low, that leaves jobless claims basically in the middle of the past year’s range which historically is still a healthy level.

Although claims were lower this week, the four-week moving average has risen for a third consecutive week to 214K. While at face value that may sound bad, there have been seven other such streaks, some of which ran for longer, in the past year alone. Now at 214K, the moving average is not at any new high either, only at its highest level since late January. In other words, the move higher in the moving average over the past few weeks has been far from dramatic and still is too early to call it a change in trend.

Non-seasonally adjusted numbers also remain at historically low levels with this week’s 200.2K print being the lowest of the current week of the year of this cycle. That is also over 100K below the 333.06K average for the current week of the year since 2000. Start a two-week free trial to Bespoke Institutional to access our interactive economic indicators monitor and much more.
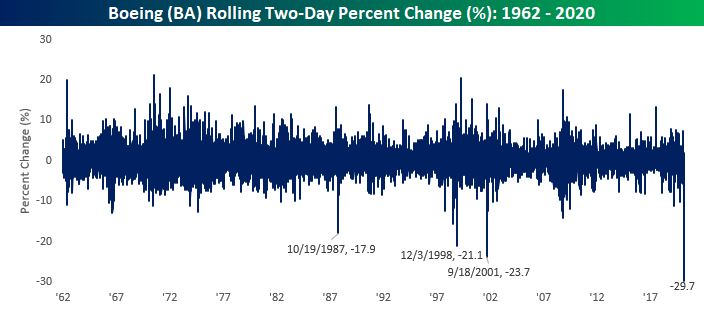
Boeing Down
Yesterday, we showed a table of how much each component of the DJIA has impacted the index since its peak on 2/12. Given the continued decline in the market today, we wanted to provide an update showing the stocks with the largest negative impact on the index over the last month. Of the roughly 7,700 points that the DJIA has dropped over the last month, Boeing’s 53% has accounted for more than 1,250 of those points. Cut in half in just a month! Boeing was close to a $200 billion company in February, and now it’s less than $100 billion!

The decline in Boeing (BA) over the last two days is literally unlike anything the stock has ever seen before. The chart below shows the rolling two-day performance for BA going all the way back to 1962. If this morning’s levels remain in place (and prices have been moving wildly), it will be the largest two-day decline (-29.7%) for the stock on record. While the stock saw declines of over 20% in 1998 and after 9/11, those declines were nowhere close to what we are seeing today. Looking to make some sort of sense of all these crazy market moves? Start a two-week free trial to Bespoke Institutional for full access to all of our research and tools.