Chart of the Day – Steepest Decline Since the Great Depression
Bespoke’s Morning Lineup – 3/23/20 – Fed Raises a Couple of Stacks
See what’s driving market performance around the world in today’s Morning Lineup. Bespoke’s Morning Lineup is the best way to start your trading day. Read it now by starting a two-week free trial to Bespoke Premium. CLICK HERE to learn more and start your free trial.
While they are far from going all in, the Federal Reserve just raised a couple of stacks this morning by introducing a slew of new measures to help stem the pressure of the medically induced coma that the US economy has been put into. Among the measures taken, the Fed announced unlimited QE and would purchase $375 billion in Treasuries and $250 billion in mortgage securities this week. Other measures being taken include purchases of MBS securities, corporates, and the launch of three new lending facilities. We’ll have more details later today.
Futures have surged on the news and what was looking like a 3% decline at the open is now looking like a 3% gain. Obviously, that’s encouraging, and while the Fed’s actions are an enormous help, the only way the markets are going to find sustainable improvement is when the economy is allowed to come back to life, or at least there is a real path in place for how that is going to happen. Also, as we have seen repeatedly over the last month, where the market is one minute can be wildly different from where it was a few minutes before.
Read today’s Bespoke Morning Lineup for a discussion of the latest moves in Asian and European markets and the latest coronavirus case counts, including a discussion of some encouraging trends in the state of Washington.

We’ve been showing a number of crazy charts over the last several weeks, and it seems as though with each day that passes they only get more extreme. The chart below showing the 20-day rolling dollar value traded in the S&P 500 ETF (SPY) is another example. Through Friday, this total reached $1.5 trillion, which was up more than five-fold from where it was earlier this year and much higher than any other reading seen throughout the history of the ETF.

Bespoke Brunch Reads: 3/22/20
Welcome to Bespoke Brunch Reads — a linkfest of the favorite things we read over the past week. The links are mostly market related, but there are some other interesting subjects covered as well. We hope you enjoy the food for thought as a supplement to the research we provide you during the week.
While you’re here, join Bespoke Premium for 3 months for just $95 with our 2020 Annual Outlook special offer.
Epidemiology
Coronavirus: The Hammer and the Dance by Tomas Pueyo (Medium)
After the initial surge in cases, society will have to work hard to prevent new surges of cases as the virus continues to circulate at a much slower rate within the broad population. [Link]
99% of Those Who Died From Virus Had Other Illness, Italy Says by Tommaso Ebhardt, Chiara Remondini, and Marco Bertacche (Bloomberg)
As a share of total deaths in Italy, only 0.8% came to patients who had no other major illness, pathology, or comorbidity like heart disease, diabetes, a history of cancer, or asthma. Roughly half of deaths came from individuals with three or more such complications, suggesting only specific populations are at mortal risk from the virus. [Link; auto-playing video]
What if there already is a large latent-immune population? by Brett Winton (Medium)
The author proposes that existing immunities to the coronavirus that causes common colds exist in the population and may serve to cap the spread of COVID-19. [Link]
Coronavirus Is Hiding in Plain Sight by Benedict Carey (NYT)
Some studies suggest that so many people are so lightly impacted by COVID-19 that there are five to ten undetected infections for every one person that tests positive. [Link; soft paywall]
A human monoclonal antibody blocking SARS-CoV-2 infection by Chunyan Wang, Wentao Li, Dubravka Drabek, Nisreen M.A. Okba, Rien van Haperen, Albert D.M.E. Osterhaus, Frank J.M. van Kuppeveld, Bart L. Haagmans, Frank Grosveld, and Berend-Jan Bosch (bioxRxiv)
The authors claim to have identified an antibody which would neutralize the virus as a possible mean for both prevention and treatment of the disease. [Link]
Corona Controversies
To Track Virus, Governments Weigh Surveillance Tools That Push Privacy Limits by Kirsten Grind, Robert McMillan and Anna Wilde Mathews (WSJ)
A variety of technological solutions for the COVID-19 outbreak are likely to bring the government and technology companies into direct conflict with civil rights and advocacy groups. [Link]
A Generational War Is Brewing Over Coronavirus by Bojan Pancevsk, Stacy Meichtry, and Xavier Fontdegloria (WSJ)
Social gatherings of young people are a potent source for the spread of the coronavirus, but that group of the population doesn’t see much risk from COVID-19 and may create major risks for groups that face a higher death rate or partiers themselves. [Link]
A Costco Corporate Employee Died From COVID-19, But Staff Still Need Approval To Work From Home by Brianna Sacks (BuzzFeed)
A company policy designed to show solidarity with front-line retail workers meant no working from home for corporate employees of Costco in Seattle, even after an employee at the office died from the disease. [Link]
Viral Solutions
IBM Supercomputer Summit Attacks Coronavirus… by Anders Quitzau (IBM)
The Oak Ridge National Lab is using an IBM supercomputer that uses 27,000 NVIDIA GPUs and 9,216 CPUs to identify molecules which may serve as a potential method of defeating the virus. [Link]
The Surprising Way Durham Distillery is Helping Fight Coronavirus by Caroline Sanders (Garden & Gun)
A North Carolina distillery had flipped production from potent potables to stronger stuff which can serve as a sanitizing product; demand has surged amidst shortages across the country. [Link]
Firm ‘refuses to give blueprint’ for coronavirus equipment that could save lives by Faye Brown (Metro)
A hospital in Brescia ran out of a small oxygen valve that served as a key component in a ventilator; a local with a 3-D printer reverse-engineered the part and was producing it at home within hours. [Link]
Sports
NASCAR is taking advantage of esports after postponing live events due to the coronavirus pandemic by Mariel Soto Reyes (Business Insider)
Stock car drivers are heading to a virtual race track after all races have been postponed through May 3rd. Drivers will compete online instead of in-person. [Link]
AP sources: MLB could skip draft; service time big issue by Ronald Blum (AP)
As leagues reel from cancelled games and lost revenue, baseball is considering skipping its draft as players demand credit for a season of service even if a full slate is never played. [Link]
Investor Impact
Hedge Funds Hit by Losses in ‘Basis Trade’ by Juliet Chung (WSJ)
Fixed income relative value has been wrecked by the volatility brought on by COVID-19, and the relationship between cash bonds and futures has been a special source of pain across various chunks of the fund universe. [Link; paywall]
Brace for earnings numbers like you’ve never seen before by Sam Ro (Yahoo! Finance)
Earnings season is just around the corner and it is set to be absolutely horrific thanks to the widespread declines in economic activity brought on by COVID-19. [Link; auto-playing video]
Rich People Are Raising Cash From Their Art Collections by Katya Kazakina and Tom Mecalf (MSN/Bloomberg)
Cash is cash, and with all cash fungible you find liquidity where you can. These days, for the wealthiest, that place is in fine art, with a $10mm Basquiat, $30mm in rare contemporary art, and financing trades on existing purchases all going through. [Link]
Corona Malfeasance
Weeks Before Virus Panic, Intelligence Chairman Privately Raised Alarm, Sold Stocks by Tim Mak (NPR)
The chairman of the Senate Intelligence Committee, Senator Richard Burr of North Carolina, warned a private group of donors and liquidated an equity portfolio after receiving a private briefing on the COVID-19 outbreak in February, contrary to public advice from the administration. [Link]
Timeline: The early days of China’s coronavirus outbreak and cover-up by Bethany Allen-Ebrahimian (Axios)
The spread and severity of COVID-19 around the world has been amplified by numerous policy mistakes, but its original spread in China was farther and faster than necessary thanks to mistakes made inside that country. [Link]
Gaia’s Revenge
‘Nature is taking back Venice’: wildlife returns to tourist-free city by John Brunton (The Guardian)
Venetian lagoons are clearing up as COVID-19 keeps tourists, cruise ships, and speed boats at bay. [Link]
This Boeing 787 Just Set a Record for the Longest-Ever Passenger Flight, Thanks to Virus by Rob Stumpf (The Drive)
Unable to land in Los Angeles, the Tahiti-Charles de Gaulle 787 Dreamliner flight spent just fewer than 10,000 miles in the air thanks to just under 16 hours of steady flying. [Link]
Read Bespoke’s most actionable market research by joining Bespoke Premium today! Get started here.
Have a great weekend!
The Bespoke Report Newsletter – 3/20/20
The Closer: End of Week Charts — 3/20/20
Looking for deeper insight on global markets and economics? In tonight’s Closer sent to Bespoke clients, we recap weekly price action in major asset classes, update economic surprise index data for major economies, chart the weekly Commitment of Traders report from the CFTC, and provide our normal nightly update on ETF performance, volume and price movers, and the Bespoke Market Timing Model. We also take a look at the trend in various developed market FX markets.

The Closer is one of our most popular reports, and you can sign up for a free trial below to see it!
See tonight’s Closer by starting a two-week free trial to Bespoke Institutional now!
Daily Sector Snapshot — 3/20/20
What’s In Store For Unemployment
We’ve been keeping track of state jobless claim filings around the country as they’ve been reported in the media, and the numbers are grim. Based on a wide range of states that have reported just a couple of days’ worth of statistics, filings look to be just shy of 1 million for the week (due to be reported next Thursday, March 26th). Of course, those numbers could come in much higher through the week. We saw one broker economics department estimate the total number at 2.5 million. We also like to look at Google Trends data, because it generally tracks claims pretty well. If the numbers from that unofficial data are even close to correct, the US is going to report somewhere between 1.3 million and 1.5 million initial jobless claims in six days.
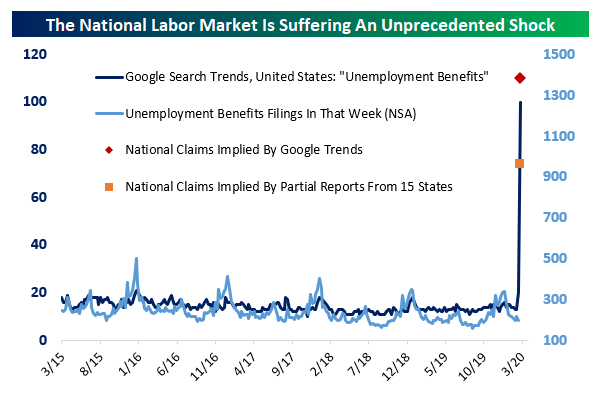
It’s worth thinking about what that mechanically means for the unemployment rate. The chart below shows a range of four different unemployment rates that would come about from job losses as detailed. Assuming next week’s onslaught of claims is only the beginning, it wouldn’t take long to get to an unemployment rate near the highs around 10% from the last recession. If the US sheds more than a million jobs in the first week as a starting point this week, it’s easy to see how fast the unemployment rate could rise.

Bespoke’s Morning Lineup – 3/20/20 – 6.5 Hours Left
See what’s driving market performance around the world in today’s Morning Lineup. Bespoke’s Morning Lineup is the best way to start your trading day. Read it now by starting a two-week free trial to Bespoke Premium. CLICK HERE to learn more and start your free trial.
Futures started out the overnight session weak, rallied throughout the night, but have been giving up ground ever since. We have no idea where they’ll be by the time the market opens (or closes for that matter). At the recent pace, though, they won’t be positive by the time equities open for trading. We would note that if the S&P 500 does manage to finish the day higher, it would be the first back to back gains for the S&P 500 since February 12th!
Along with US equities, just about every financial asset except for volatility products and the US dollar are higher. The moves higher look pretty reasonable and restrained, and that would be a huge improvement for the function and orderliness of US financial markets even if we have not yet seen a major bottom for equities start to carve out yet. The best thing for everyone is that markets will close for the weekend shortly and give investors, central bankers, lawmakers, and most importantly, health care professionals an opportunity to assess their actions over the last few weeks to see what has worked and what hasn’t. They can also take into account new developments and alter their actions accordingly. Conditions have been very fluid, but a lot still needs to be done. The bottom line is that the status quo of an indefinite economic lockdown is unsustainable for everybody.
Read today’s Bespoke Morning Lineup for a discussion of the latest uptake in Fed liquidity programs, European markets, credit market dislocations, and coronavirus case counts.
Charts like the one of crude oil’s daily changes can be found across just about every different asset class these days. Yesterday, WTI crude oil had its largest one-day daily gain on record, rising by 23.8%. That move followed the second and third largest one-day declines for crude oil on record from 3/9/20 (-24.6%) and 3/18/20 (-24.4%), respectively. Not sure what you want to call it, but it’s far from rational market behavior.

The Closer – Vol Must Fall, Markets Must Clear – 3/19/20
Log-in here if you’re a member with access to the Closer.
Looking for deeper insight on markets? In tonight’s Closer sent to Bespoke Institutional clients, we begin with reason that volatility may come down before turning to fixed income markets. Next we turn to the massive moves seen in crude oil. We finish with a look at weekly consumer comfort data from Bloomberg.

See today’s post-market Closer and everything else Bespoke publishes by starting a 14-day free trial to Bespoke Institutional today!