This Week’s Economic Indicators – 4/6/20
Economic data has continued to show the adverse impact of the coronavirus, but the bulk of last week’s economic data actually came in better than estimates or the prior period. One of the main points of weakness has been manufacturing data. The last of the regional Fed indices, the Dallas Fed, came out last week with a massive decline to -70 compared to estimates of -10. While ISM’s headline number held up and even beating estimates, under the hood, it was much weaker with a collapse in New Orders. Jobless claims have continued to surge and were once again a major focus of the week’s data after rising to 6,648K. But claims were not the only labor data point out last week. Friday’s nonfarm payroll report saw the biggest miss relative to expectations on record and the first decline in nearly a decade.

Turning to this week, the data slate will lighten up quite a bit. Today there are no releases scheduled with the February JOLTS report and Consumer Credit data kicking things off tomorrow. The last reading for JOLTS showed a massive decline and miss. Elsewhere in labor data, jobless claims are forecasted to moderate slightly. Granted, they are still expected to print around 5 million. PPI and CPI inflation data are also on the docket set to be released Thursday and Friday, respectively. Although there is some data being released on Friday, markets will be closed due to the Good Friday holiday. Start a two-week free trial to Bespoke Institutional to access our interactive economic indicators monitor and much more.

Chart of the Day – Big Gains By Midday
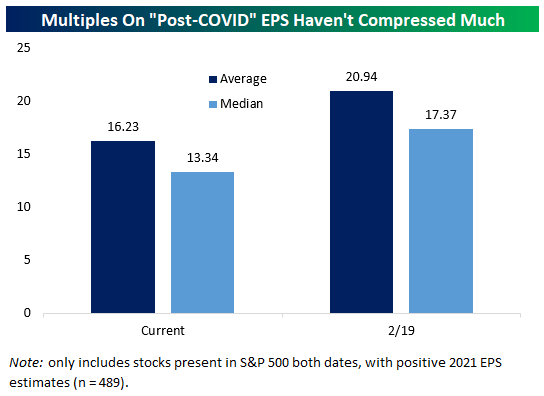
Longer-Term Multiples Remain Similar to Mid-February
Markets understand pretty well just how badly earnings are going to be hit in 2020, and we’ll start to get a more specific view of that with earnings reports that start next week. There’s a good argument to be made that longer-term earnings should be the touchstone for equity valuation, looking past the near-term COVID shock to EPS. With that in mind, how cheap are stocks getting relative to estimated earnings in the longer-term? As shown in the chart below, not very much. Multiples on calendar 2021 EPS estimates were 20.9x on average in February, versus 16.2x today. That’s certainly a notable compression, but it’s not anything we would call dramatic. On a median basis, the compression has been from 17.4x to 13.3x, again nothing overly dramatic. There’s a compelling case to be made for US stocks given the recent peaking of European new case counts and flattening of US case counts in major outbreak states, of course. But valuation doesn’t seem to be as compelling as a justification for owning the market here. Start a two-week free trial to one of Bespoke’s three premium memberships to see our best and most actionable market analysis.
March 2020 Headlines
Bespoke’s Morning Lineup – 4/6/20 – A Good Start
See what’s driving market performance around the world in today’s Morning Lineup. Bespoke’s Morning Lineup is the best way to start your trading day. Read it now by starting a two-week free trial to Bespoke Premium. CLICK HERE to learn more and start your free trial.
Some relatively encouraging news over the weekend regarding the status of the COVID-19 outbreak in both Europe and the US has equity futures and other risk assets in rally mode this morning. In recent weeks, there has been some variability in weekend data, so that will make today’s updates on the outbreak even more important. If the recent trajectory of case counts and deaths manages to hold, though, it would be one of the most encouraging trends we have seen in weeks.
Read today’s Bespoke Morning Lineup for a discussion of the latest trends and statistics of the outbreak, an analysis of the factors driving stocks in Europe in today’s rally, and the latest investor expectations surveys out of Europe.

The S&P 500 and most sectors are starting out the week at oversold levels, but we’ve definitely started off prior weeks on a worse footing recently. In fact, two sectors (Consumer Staples and Health Care) aren’t even oversold. If today’s pre-market rally in the futures holds, we could finish off the day with no sectors at oversold levels. Wouldn’t that be nice?

Bespoke Brunch Reads: 4/5/20
Welcome to Bespoke Brunch Reads — a linkfest of the favorite things we read over the past week. The links are mostly market related, but there are some other interesting subjects covered as well. We hope you enjoy the food for thought as a supplement to the research we provide you during the week.
While you’re here, join Bespoke Premium for 3 months for just $95 with our 2020 Annual Outlook special offer.
Small Business
Poll: Almost one in four small businesses are two months or less away from closing permanently by Alex Gangitano (The Hill)
A US Chamber of Commerce/MetLife pole showed large swathes of the small business landscape could disappear in short order without help. [Link]
Banks stand to make billions from US small business rescue by Brendan Greeley & Robert Armstrong (FT)
With a cash payment as incentive to originate and service loans, banks stand to gain billions of revenue from helping small businesses access the $350bn in small business funding included in the CARES Act. [Link; paywall]
Private Equity Frets That It’s a Loser in $2 Trillion Virus Bill by Robert Schmidt & Heather Perlberg (Bloomberg)
Private equity firms are worried that firms they own may not be eligible for small business loans because of the definition of “small business” in the bill. [Link; soft paywall]
Investing
How to safely take money from your retirement account now by Josh Brown (The Reformed Broker)
A series of helpful Q&As regarding the tax consequences of using retirement funds to get through the current COVID-19 crisis. [Link]
How I Learned to Stop Worrying and Love the Bear Market by Spencer Jakab (WSJ)
Why waiting for clear signal that the worst pain is over makes it more likely that you’ll miss all of the upside during bull markets which follow big down-drafts. [Link; paywall]
National Response
National coronavirus response: A road map to reopening by Scott Gottlieb (AEI)
Mass testing, expanded surveillance, improvements in the supply chain, and new options for treatment are necessary steps for the US and other countries to deal with COVID-19. [Link]
The U.S. Tried to Build a New Fleet of Ventilators. The Mission Failed. by Nicholas Kulish, Sarah Kliff & Jessica Silver-Greenberg (NYT)
The story of an innovative and cheap new design for a ventilator that would have entered the national stockpile if its designer hadn’t been bought out by a company with opposing interests. [Link; soft paywall]
Mass testing, empty ICUs: Germany scores early against virus by Frank Jordans (AP)
German scientists and public health officials were far ahead of the rest of Europe in designing and implementing testing. [Link]
Social Distancing
Anatomy of an Outbreak: How Coronavirus Swept Through JPMorgan’s Trading Floor by Rob Copeland & David Benoit (WSJ)
A sick employee made it in to the office to support huge trading volumes on March 9th, but appears to have spread COVID-19 to about 20 coworkers, illustrating the conflict between containing spread and keeping business moving. [Link; paywall]
Social Distancing in New York City by Michiel Bakker, Alex Berke, Matt Groh, Alex ‘Sandy’ Pentland, & Esteban Moro (Medium)
An impressive summary of how the New York region is responding to stay-at-home orders and efforts to restrict movement. [Link]
What Social Distancing Looked Like in 1666 by Annalee Newitz (NYT)
The Black Death, caused by the bacteria yrsinia pestis, is one of the original examples of mass pandemics, and the response of society has much to teach us today. [Link; soft paywall]
Economic Fallout
Stabilizing State and Local Budgets through the Pandemic and Beyond by Alexander Williams (Levy Economics Institute of Bard College)
The author proposes an automatic stabilizer program that provides unrestricted grants to state governments from the federal government using a formula based on unemployment rate changes. [Link; 4 page PDF]
The coronavirus economic crisis is here. Unemployment office workers are on the front lines. by April Glaser (NBC)
As 10 million workers in two weeks slam the unemployment insurance system, workers are on the front lines of the response underway to prevent the worst economic fallout. [Link]
Rent
This Brooklyn Landlord Just Canceled Rent for Hundreds of Tenants by Matthew Haag (NYT)
A landlord with 18 buildings hosting between 200 and 300 tenants cancelled rent for April, a piece of generosity that tenants say isn’t out of character. [Link; soft paywall]
Kids
Remote learning is turning out to be a burden for parents by Karol Markowicz (NYP)
While the technological underpinnings of distance learning are sound, the expectations and push-and-pull between students, teachers, and parents is starting to grate. [Link]
Toy sales surge as coronavirus pandemic keeps kids home by Lisa Fickenscher (NYP)
In order to entertain children, parents are shelling out cash for anything that can hold their attention for a couple of hours. [Link]
Changing Demand
What Everyone’s Getting Wrong About the Toilet Paper Shortage by Will Oremus (Marker)
Could people be buying more toilet paper than usual simply because they are spending more time at home and therefore can’t use toilet paper supplied to public facilities? [Link]
Booze buying surges; senators push airlines for cash refunds (AP)
A rundown on some of the economic effects of the COVID-19 pandemic, which includes a staggering 55% increase in alcohol sales for the week as Americans turn to tipple during this time of stress. [Link]
While Many Restaurants Struggle, Here’s How One Is Thriving by Joe Ray (Wired)
Restaurateur Eric Rivera has shifted his Puerto Rican-influenced Seattle eatery Addo into the COVID world, which includes a unique range of delivery offerings and gives customers the ability to offer meals to the homeless via “pay it forward” bowls. [Link]
Military Matters
China seizes Covid-19 advantage in South China Sea by Richard Javad Heydarian (Asia Times)
With the rest of the world focused on dealing with viral outbreaks, China has ramped up activity in the contested waters it claims against a number of other countries. [Link]
China Concealed Extent of Virus Outbreak, U.S. Intelligence Says by Nick Wadhams & Jennifer Jacobs (Bloomberg)
Classified US intelligence estimates show that Chinese case counts and deaths are far above official numbers reported to the outside world, based on anecdotal reports and other data sources. [Link; auto-playing video, soft paywall]
Air Force Academy relaxes social-distancing rules after cadet suicides by Yaron Steinbuch (NYP)
Stress is running high for cadets that have to cope with lockdown conditions which may have led to multiple suicides on campus. [Link]
Weird Science
Key ingredient in coronavirus tests comes from Yellowstone’s lakes by Maya Wei-Haas (National Geographic)
A thermal pool in Yellowstone National Park yielded an unusual microbe which produces enzymes that is today a key input to PCR tests necessary for COVID-19 detection. [Link]
Read Bespoke’s most actionable market research by joining Bespoke Premium today! Get started here.
Have a great weekend!
B.I.G. Tips – After Hours vs. Intraday Performance During the COVID Crash
Thank Goodness for Tuesday
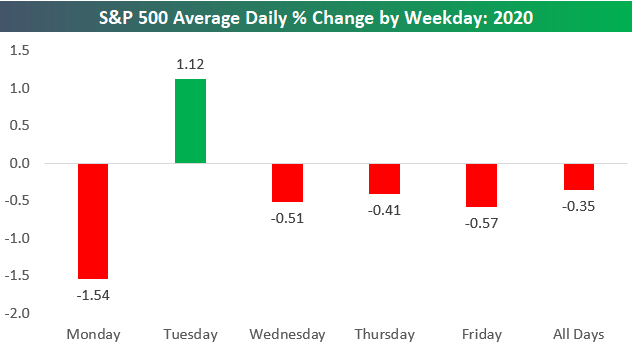
The S&P 500 has averaged a daily change of -0.35% so far in 2020, which is a horrific number. Keep in mind too, that up until late February, the market was still up YTD, so these negative numbers a primarily a result of the last six weeks! For some perspective, if the S&P were to continue averaging a daily decline of 0.35% for the remainder of the year, the index would be at 1,335.3 on the last day of 2020 for a YTD decline of 58.7%. That would represent at 45% drop from the S&P’s current level of 2,448.
Below is a look at the average daily performance of the S&P 500 by weekday so far in 2020. Mondays have been by far the worst with an average decline of 1.54%. Wednesday, Thursday, and Friday have all seen similar returns with average declines around the -0.50% level. Tuesdays have been the lone bright spot during the week with an average gain of 1.12%. Thank goodness for Turnaround Tuesday! Start a two-week free trial to one of Bespoke’s three premium memberships to see our best and most actionable market analysis.
The Bespoke Report — 4/3/20
This week’s Bespoke Report newsletter is now available for members.
Volatility has dropped, but the outlook for equity markets hasn’t improved very much thanks to no daylight in the COVID-19 tunnel and the massive shock to labor markets that has become more clear this week. We cover equity and credit markets, economic data, and more in this week’s report. To read the report and access everything else Bespoke’s research platform has to offer, start a two-week free trial to one of our three membership levels. You won’t be disappointed!

The Closer: End of Week Charts — 4/3/20
Looking for deeper insight on global markets and economics? In tonight’s Closer sent to Bespoke clients, we recap weekly price action in major asset classes, update economic surprise index data for major economies, chart the weekly Commitment of Traders report from the CFTC, and provide our normal nightly update on ETF performance, volume and price movers, and the Bespoke Market Timing Model. We also take a look at the trend in various developed market FX markets.

The Closer is one of our most popular reports, and you can sign up for a free trial below to see it!
See tonight’s Closer by starting a two-week free trial to Bespoke Institutional now!