The Bespoke Report Newsletter — 3/6/20
The Closer: End of Week Charts — 3/6/20
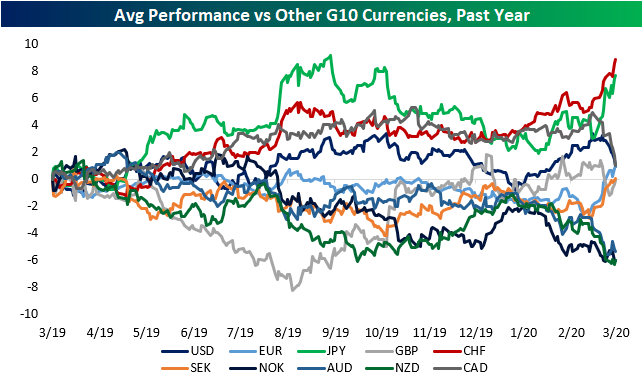
Looking for deeper insight on global markets and economics? In tonight’s Closer sent to Bespoke clients, we recap weekly price action in major asset classes, update economic surprise index data for major economies, chart the weekly Commitment of Traders report from the CFTC, and provide our normal nightly update on ETF performance, volume and price movers, and the Bespoke Market Timing Model. We also take a look at the trend in various developed market FX markets.
The Closer is one of our most popular reports, and you can sign up for a free trial below to see it!
See tonight’s Closer by starting a two-week free trial to Bespoke Institutional now!
Daily Sector Snapshot — 3/6/20
It Doesn’t Get Much Worse Than This For Crude Oil
Crude oil prices are down close to 10% today in what is shaping up to be the worst day for crude oil since late 2014. That’s more than five years.

Today’s decline is pretty much a continuation of what has been a one-way trade for the commodity ever since the US drone strike on Iranian general Soleimani. The last time prices were this low was around Christmas 2018.

With today’s decline, crude oil is now off to its worst start to a year in a generation falling 32%. Since 1984, the only other year that was worse was 1986 when the year started out with a decline of 50% through March 6th. If you’re looking for a bright spot, in 1986, prices rose 36% over the remainder of the year. The only other year where crude oil kicked off the year with a 30% decline was in 1991 after the first Iraq war. Over the remainder of that year, prices rose a more modest 5%. Start a two-week free trial to Bespoke Institutional to access all of our research an interactive research tools.

A “Run of the Mill” Drawdown
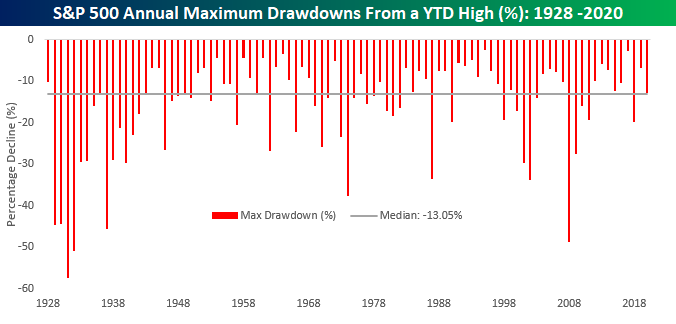
If you’re like us, you’ve heard a lot of people reference the recent equity declines as a sign that the market is pricing in some sort of Armageddon in the US economy. While comments like that make for great soundbites, a little perspective is in order. Since the S&P 500’s high on February 19th, the S&P 500 is down 12.8%. In the chart below, we show the S&P 500’s annual maximum drawdown by year going back to 1928. In the entire history of the index, the median maximum drawdown from a YTD high is 13.05%. In other words, this year’s decline is actually less than normal. Perhaps due to the fact that we have only seen one larger-than-average drawdown in the last eight years is why this one feels so bad.
The fact that the current decline has only been inline with the historical norm raises a number of questions. For example, if the market has already priced in the worst-case scenario, going out and adding some equity exposure would be a no brainer. However, if we’re only in the midst of a ‘normal’ drawdown in the equity market as the coronavirus outbreak threatens to put the economy into a recession, one could argue that things for the stock market could get worse before they get better, especially when we know that the market can be prone to over-reaction in both directions. The fact is that nobody knows right now how this entire outbreak will play out. If it really is a black swan, the market definitely has further to fall and now would present a great opportunity to sell more equities. However, if it proves to be temporary and after a quarter or two resolves itself and the economy gets back on the path it was on at the start of the year, then the magnitude of the current decline is probably appropriate. As they say, that’s what makes a market! Start a two-week free trial to Bespoke Institutional to access all of our research an interactive research tools.
Long-Term Treasuries Go Haywire
Take a good luck at today’s moves in long-term US Treasury yields, because chances are you won’t see moves of this magnitude again soon. Let’s start with the yield on the 30-year US Treasury. Today’s decline of 29 basis points in the yield will go down as the largest one-day decline in the yield on the 30-year since 2009. For some perspective, there have only been 25 other days since 1977 where the yield saw a larger one day decline.
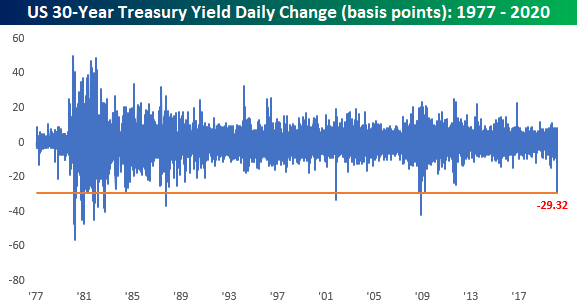
That doesn’t even tell the whole story, though. As shown in the chart below, every other time the yield saw a sharper one-day decline, the actual yield of the 30-year was much higher, and in most other cases it was much, much higher.

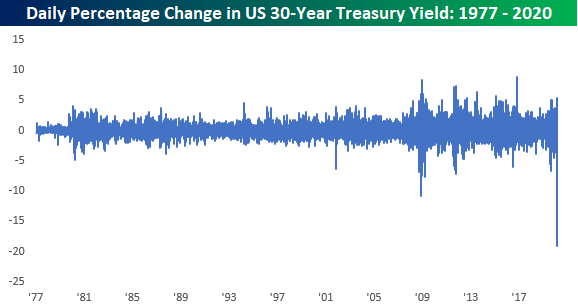
To show this another way, the percentage change in the yield on the 30-year has never been seen before, and it’s not even close. Now, before the chart crime police come calling, we realize showing a percentage change of a percentage is not the most accurate representation, but we wanted to show this for illustrative purposes only.
Finally, with long-term interest rates plummetting we wanted to provide an update on the performance of the Austrian 100-year bond. That’s now back at record highs, begging the question, why is the US not flooding the market with long-term debt? Start a two-week free trial to Bespoke Institutional for full access to our research and interactive tools.

Bespoke’s Morning Lineup – 3/6/20 – Corona Friday
See what’s driving market performance around the world in today’s Morning Lineup. Bespoke’s Morning Lineup is the best way to start your trading day. Read it now by starting a two-week free trial to Bespoke Premium. CLICK HERE to learn more and start your free trial.
With headlines likely to get worse before they get any better, investors are once again in no mood to buy equities heading into a weekend. Equity futures are down over 2% and getting worse as treasury yields sink like a stone. After breaking below 1% for the first time ever earlier this week, the yield on the 10-year is now at 0.72%.
Today’s Non-Farm Payrolls report for February came in extremely strong with headline payrolls coming in at 273K versus expectations for a gain of 175K. Unfortunately, all of this data is from early February, so no one is likely going to care.
Read today’s Bespoke Morning Lineup for the latest stock-specific news of note, updates on the coronavirus, and a recap of economic data coming out of Europe.

The price chart of Europe’s STOXX 600 is really something to behold. Less than a month after hitting 52-week highs, the index is now knocking on the door of 52-week lows. It’s rare enough to see this type of a reversal in an individual stock, but for a benchmark equity index of an entire continent, it’s nuts. With a decline of over 3% today, the STOXX 600 is now less than 2% from hitting that level. As we discussed in the Morning Lineup, this is just a further illustration of how before the coronavirus breakout started, the global economy was starting to accelerate.

The Closer – Plunging Rates, Glittering Gold – 3/5/20
Log-in here if you’re a member with access to the Closer.
Looking for deeper insight on markets? In tonight’s Closer sent to Bespoke Institutional clients, we review the continued decline in small caps relative to the S&P 500 and outperformance of momentum stocks relative to value stocks. Next, we review the rapid changes in financial stress indices from the St. Louis Fed and Goldman Sachs. We also show the gold market’s reaction. Turning to economic data, we review today’s manufacturing data and Bloomberg Consumer Comfort.

See today’s post-market Closer and everything else Bespoke publishes by starting a 14-day free trial to Bespoke Institutional today!