Bespoke’s Morning Lineup – 5/22/20 – Quiet Finish
See what’s driving market performance around the world in today’s Morning Lineup. Bespoke’s Morning Lineup is the best way to start your trading day. Read it now by starting a two-week free trial to Bespoke Premium. CLICK HERE to learn more and start your free trial.
It wasn’t looking like a positive end to the week for equities, but futures have bounced in the last hour or so, and are now pointing to a flat to slightly positive open. The data calendar is quiet this morning, and barring any major headlines, trading is likely to slow down as the day progresses heading into the holiday weekend.
Be sure to check out today’s Morning Lineup for a rundown of the latest stock-specific news of note, news in global markets, global and national trends related to the COVID-19 outbreak, and much more.

New laws from China related to curtailing civil liberties in Hong Kong have raised concerns over a new round of protests in the region, and the result was a steep sell-off in Hong Kong stocks overnight. The benchmark Hang Seng (HSI) fell over 5.5% for its weakest one-day decline since 7/8/15. Since 2000, last night’s decline was the 24th time since 2000 that the Hang Seng (HSI) dropped more than 5% in a single session. Following those 23 prior occurrences, the HSI saw an average gain of 1.2% (median: 1.7%) the following day with positive returns 70% of the time. While the HSI tended to bounce back a bit the following day, the average change over the following month wasn’t nearly as strong with an average and median decline of -0.2% and positive returns less than half of the time (48%).
For the here and now, last night’s decline in the HSI was a bit discouraging as the index broke down after several failed attempts to break above short-term resistance.

Bespoke’s Weekly Sector Snapshot — 5/21/20
The Bespoke 50 Top Growth Stocks — 5/21/20
Every Thursday, Bespoke publishes its “Bespoke 50” list of top growth stocks in the Russell 3,000. Our “Bespoke 50” portfolio is made up of the 50 stocks that fit a proprietary growth screen that we created a number of years ago. Since inception in early 2012, the “Bespoke 50” has beaten the S&P 500 by 119.2 percentage points. Through today, the “Bespoke 50” is up 233.4% since inception versus the S&P 500’s gain of 114.2%. Always remember, though, that past performance is no guarantee of future returns. To view our “Bespoke 50” list of top growth stocks, please start a two-week free trial to either Bespoke Premium or Bespoke Institutional.

B.I.G. Tips – Yields Remain Heavy
Bears Slow to Back Off
With the S&P 500 up around 4% since last Thursday’s close, bullish sentiment has unsurprisingly picked up with the percentage of investors reporting as bullish in AAII’s survey rising to 29% this week off of the recent low of 23.31% last week. At that level, bullish sentiment still remains low below levels seen as recently as the last week of April when it was at 30.6%.

The bulk of investors remain bearish. A little over 45% reported as such this week which was an improvement from readings of over 50% over the past two weeks. Similar to bullish sentiment, that leaves bearish sentiment at its lowest level since the last week of April.
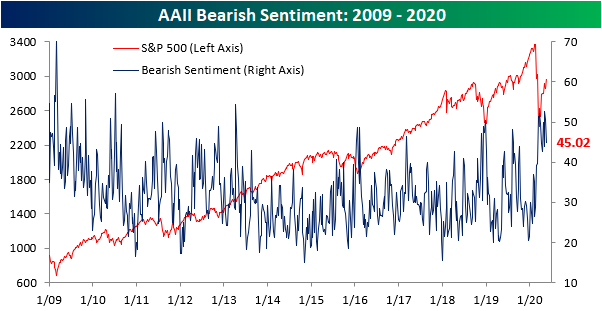
While improved, bearish sentiment remains elevated relative to its historical readings as it has been for some time now. In fact, it has been above its historical average of 30.5% for 13 consecutive weeks now. That is tied with another 13-week long streak that lasted from the end of 2018 through the first weeks of 2019 for the longest stretch of above-average bearish readings since a 15-week long run that ended in August of 2012. Granted, that is not nearly as long of a time of high bearish readings as was seen in the years of the Financial Crisis. Back then bearish sentiment came in above average for 83 straight weeks. But as shown in the second chart below, bearish sentiment has not only been just above average. It has been so by at least one standard deviation for 11 straight weeks. That is now the fourth-longest steak on record and the longest since 2008’s 14-week run.

Neutral sentiment has been pretty stable with around a quarter of respondents reporting as such over the past several weeks. After recovering from its multiyear low of 14.5% in March, neutral sentiment has remained within two percentage points of 25% for each of the past five weeks. Start a two-week free trial to Bespoke Institutional to access our interactive economic indicators monitor and much more.

Chart of the Day: A Tale Of Two Issuances
Claims Continue to Fall, Continuing Claims Continue to Rise
For the seventh week in a row, jobless claims have been falling coming in at 2.438 million which was above forecasts of 2.4 million. This week’s 2.438 million number is the lowest claims data point since the first spike in March. That is certainly a positive as those declines are a sign of improvement, but claims also continue to print at much higher levels than anything observed prior to COVID-19 as the running total since the first print over one million in March now stands at 38.6 million. That is roughly 11.8% of the US population or 23.5% of the labor force.
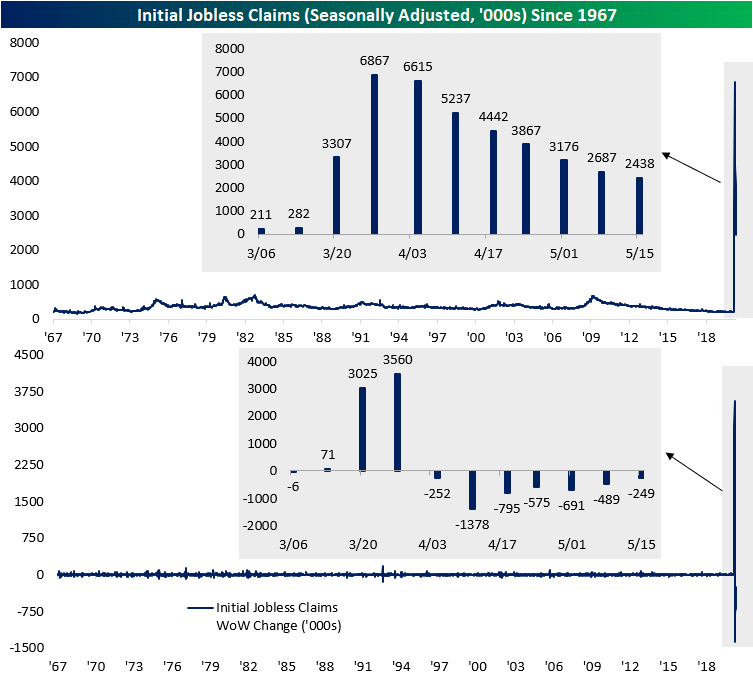
As previously mentioned, this was the seventh consecutive week in which jobless claims declined week over week. As shown in the chart below that is an unprecedented streak. In the data going back to the late 1960s, there have only been two other stretches of seven weeks of declines: one ending in October of 1980 and another ending in November of 2013. Given jobless claims are at such extremely high levels and have very far to fall until they return to normal, this streak certainly could keep growing.

As for the non-seasonally adjusted data, this was only the sixth consecutive week with a decline, but this week’s 2.174 million number, as with the seasonally adjusted number, is also the lowest print since the first of the extreme readings in March.

The four week moving average has also continued to decline consistently falling for a fourth straight week down to 3.042 million. While an improvement, this week’s decline of 501K was the smallest week over week decline since the four week moving average began to turn around four weeks ago.

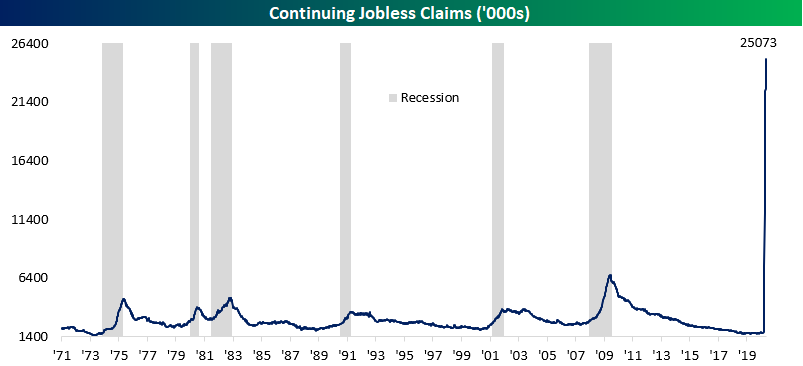
Again while initial jobless claims have been improving in recent weeks, a massive number of people in the US remain unemployed. Although lagged one week to initial jobless claims, continuing jobless claims came in at a record 25.073 million this week. Start a two-week free trial to Bespoke Institutional to access our interactive economic indicators monitor and much more.
Bespoke’s Morning Lineup – 5/21/20 – Semis Strong
See what’s driving market performance around the world in today’s Morning Lineup. Bespoke’s Morning Lineup is the best way to start your trading day. Read it now by starting a two-week free trial to Bespoke Premium. CLICK HERE to learn more and start your free trial.
In a busy day for economic data, Philly Fed, Initial Jobless Claims, and Continuing Claims have all been released so far and all three missed expectations. Still on the calendar, we have preliminary Markit PMI data, Leading Indicators, and Existing Home Sales. Futures were moderately lower early on, but have actually started to pick up steam in the aftermath of the data.
Be sure to check out today’s Morning Lineup for a rundown of the latest stock-specific news of note, the latest news in global markets, preliminary PMI data, the latest global and national trends related to the COVID-19 outbreak, and much more.
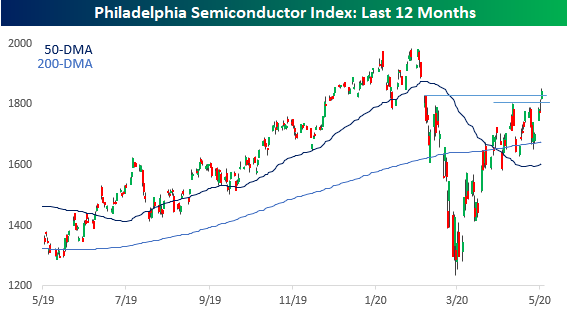
Yesterday was a strong day for semis as the group broke above short-term resistance and also into the gap from its decline on 2/24 when it gapped down below its 200-DMA. Semis the ‘Transports of the 21st Century and strength from this sector is an encouraging trend for the broader market.
Daily Sector Snapshot — 5/20/20
Fixed Income Weekly – 5/20/20
Searching for ways to better understand the fixed income space or looking for actionable ideas in this asset class? Bespoke’s Fixed Income Weekly provides an update on rates and credit every Wednesday. We start off with a fresh piece of analysis driven by what’s in the headlines or driving the market in a given week. We then provide charts of how US Treasury futures and rates are trading, before moving on to a summary of recent fixed income ETF performance, short-term interest rates including money market funds, and a trade idea. We summarize changes and recent developments for a variety of yield curves (UST, bund, Eurodollar, US breakeven inflation and Bespoke’s Global Yield Curve) before finishing with a review of recent UST yield curve changes, spread changes for major credit products and international bonds, and 1 year return profiles for a cross section of the fixed income world.
In this week’s report we take a look at high yield sectors that have taken big hits from COVID.

Our Fixed Income Weekly helps investors stay on top of fixed income markets and gain new perspective on the developments in interest rates. You can sign up for a Bespoke research trial below to see this week’s report and everything else Bespoke publishes free for the next two weeks!
Click here and start a 14-day free trial to Bespoke Institutional to see our newest Fixed Income Weekly now!