Chart of the Day: Search Trend Struggles
Daily Sector Snapshot — 6/8/20
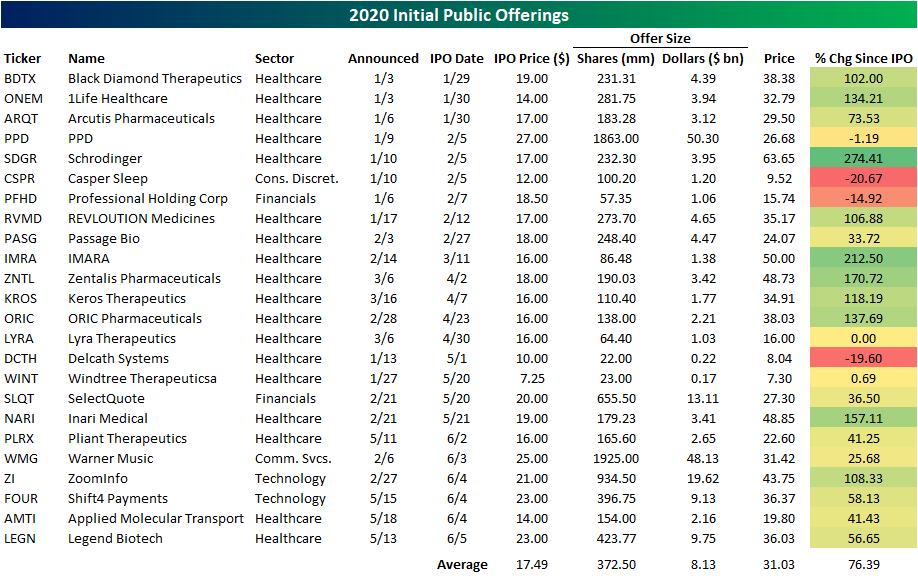
IPOs Surging
The Renaissance IPO Index actually peaked a day later than the S&P 500 on February 20th, and after a 38.2% decline, it would find a bottom a week earlier than the S&P 500 on March 18th. Since then, the index has surged. In addition to IPOs beginning to come out of the woodwork, that strong performance is partially thanks to holdings in recent IPOs like Slack (WORK) and Zoom Video (ZM) which have become staples of the COVID economy. As shown in the charts below, the index has rallied 77.8% since that March 18th low; double the S&P 500’s performance in the same time-frame. As shown in the second chart below, that has led the ratio of IPOs to the S&P 500 to have gone nearly vertical and is now at new highs; pressing above the prior decade high for the ratio from 2014.

On an individual level, IPOs in 2020 have actually done very well. So far in 2020, there have been 72 companies to announce initial public offerings. Only 24 of those have already begun trading (shown below) while another 3 have withdrawn. On average, these stocks are up 76.39% from their IPO. Fitting for a year with a global pandemic, the bulk of these IPOs have been Health Care names. The largest and one of the earliest of these was for Schrodinger (SDGR) which offered $50.3 billion. This has also been the best performing IPO this year having risen 274.41% since its IPO. IMARA (MRA) is also up over 200% since IPO though it was a much smaller offering. The second largest of the year was for Warner Music (WMG) which offered $48.13 billion of stock last Wednesday. In addition to WMG, there have been five other IPOs to hit the market in the past week. Click here to view Bespoke’s premium membership options for our best research available.
High Flying Airlines
It has been a slow crawl, but as the economy has begun to reopen travelers are slowly beginning to take to the skies again. Although TSA Total Traveler Throughput is still down 83.47% from last year, it has made headway over the past several weeks. Daily total throughput has averaged 361K over the past week compared to its worst day in mid-April when throughput was down over 96% YoY, averaging around just 95K travelers per day. In other words, air traffic has been improving but is far from out of the woods and still down significantly from last year.

That small improvement in addition to drastic underperformance earlier this spring has acted as the catalyst for massive buying into the sector. One ETF that has served as a proxy for airlines recently has been the US Global Jets ETF (JETS) which tracks airline industry-related stocks from around the globe. From its high on February 12th to its low on March 19th (both prior to the broader market’s respective high and low) JETS had fallen over 61%. After trending sideways for a bit and successfully retesting those lows, JETS has ripped higher. As of today, it is up over 75% from its recent 5/13 low.
With such a massive gain in less than a month, it has left its 50-DMA far in the rearview sitting 46.9% above its 50-day (though it is still 16.5% below its 200-DMA). That also means JETS is now at its most overbought levels ever since it first began trading in 2015 (second chart below). Tacking on another 6.4% gain today, JETS is trading 3.6 standard deviations above its 50-DMA. Prior to this run, the most overbought JETS ever became was 3.06 standard deviations above its 50-DMA in 2016.

As for the individual US airlines, it is broadly the same story. The surge in buying over the past few weeks has left those S&P 1500 stocks in the airlines industry up 60% or more since 3/23. United (UAL) and American Airlines (AAL) have gained the most with both stocks up over 100% since 5/13. As with JETS, these names are all extremely overbought now with all but three airlines (Hawaiian- HA, Allegiant- ALGT, and Southwest LUV) more than 3 standard deviations above their 50-DMAs. That is around some of the most overbought levels of the past decade as shown in the table below. Click here to view Bespoke’s premium membership options for our best research available.

Boeing (BA) Boosting the Dow
In recent weeks, we have highlighted how there has been rotation away from the best performing stocks in the first leg of the rally off of the 3/23 low while the stocks that had been the laggards have become the new market must-haves. Boeing (BA) is a prime example of this trend. Heavily connected to the decimated airline industry, BA only rose 15.04% in the first part of the rally from 3/23 to the recent 5/13 low. While not the worst stock in the index during that time, it lagged the Dow Jones Industrial Average which rose over 25%. But along with others in the industrial sector like the airlines, recent performance has been much more impressive with BA up 69.08% from 5/13 through Friday’s close. Today alone the stock is up another 11% after rallying 11.47% on Friday and 12.95% last Wednesday! That leaves it at its highest level since early March.

With such large gains in a little less than a month for a stock with one of the higher stock prices in the index, BA has added roughly 575 points to the price weighted Dow. That has by far been the largest contributor to the Dow since 5/13 accounting for roughly 14.9% of the overall move and nearly double the next biggest contributor, Goldman Sachs (GS), which added 316.32 points to the Dow, or roughly 8.19% of the overall move since 5/13. Other major contributors from the Financials sector like Travelers (TRV), American Express (AXP), and JPMorgan Chase (JPM) are some more examples of the recent rotation into stocks that lagged in the immediate wake of the bear market. Click here to view Bespoke’s premium membership options for our best research available.

Bespoke’s Morning Lineup – 6/8/20 – To the Extreme
See what’s driving market performance around the world in today’s Morning Lineup. Bespoke’s Morning Lineup is the best way to start your trading day. Read it now by starting a two-week free trial to Bespoke Premium. CLICK HERE to learn more and start your free trial.
Futures are continuing the momentum from last week as the S&P 500 is poised to open up over half of a percent. The key driver this morning? Momentum. There’s literally no data on the economic calendar to speak of and the pace of earnings is at a trickle. Traders are out in full force again bidding up stocks tied to the re-opening trade as the airlines ETF (JETS) is up over 5%, Boeing is up over 8%, and bankrupt Hertz is up 25%. The wackiest move of the day, though, belongs to Chesapeake (CHK). Shares are up nearly 100% in the pre-market after rallying over 75% on Friday. Even after the rally of the last two days, though, CHK is down 90% from its 52-week high more than 99% from its all-time high.
Be sure to check out today’s Morning Lineup for a rundown of the latest stock-specific news of note, European markets, the latest Sentix data, global and national trends related to the COVID-19 outbreak, and much more.

By all accounts the last week was extraordinary for the stock market. Sure, we’ve seen stronger weeks in the last several months, but they came from levels where prices were down sharply. After what had already been a near-record rally for US stocks in such a short period of time, the gains were only piled on in last week’s rally.
Of the 11 S&P 500 sectors, their average gain last week was over 6% and they are now an average of 13.8% above their 50-day moving averages! In our Trend Analyzer tool, we track the OB/OS conditions of 14 different major US index ETFs on a daily basis, and through Friday’s close, last week’s average performance was a gain of 6.5%. The top-performing index ETF on the week was the Core S&P Small-Cap ETF (IJR) which rallied just under 12%, while the Nasdaq 100 (QQQ) was the weakest performer of the week gaining 2.7%. In any other week, a rally of 2.7% would be a reason to celebrate.
Unfortunately, markets don’t only go in one direction, though, and after the gains we saw last week, all but two of the major index ETFs we track in our Trend Analyzer are now at ‘Extreme Overbought’ levels. That doesn’t mean we necessarily have to go down from here, but it does make the odds for at least a short-term period of consolidation more likely. If you are a long-term investor that would be a good thing.

S&P 500 Performance Breakdown: 2020
Amazingly, the average stock in the S&P 500 is now up 54.7% since the March 23rd COVID-Crash closing low for the index. From the high on February 19th through the low on March 23rd, the average stock in the S&P fell 39.13%. On a year-to-date basis, the average stock is down just 5.13%, while the average stock is down 9.06% since the February 19th all-time closing high in the index.
Here are two other stats that are pretty mind-blowing. First, there is only one stock (COTY) in the entire S&P 500 that’s down since March 23rd, and it’s down less than 2%. Second, there are only eight stocks that aren’t up more than 10% since March 23rd, and these include names like Walmart (WMT), Costco (COST), and Kroger (KR).
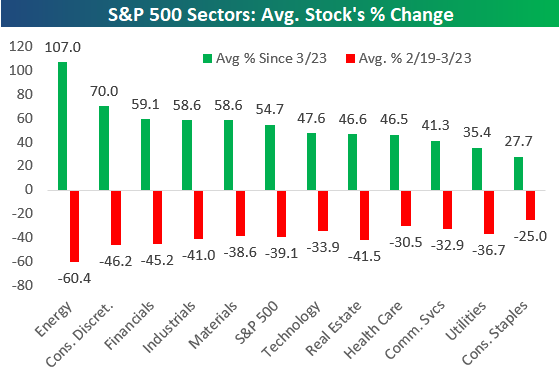
Looking at the eleven S&P 500 sectors, the average Energy sector stock is up more than 107.05% since March 23rd. Note, however, that these Energy stocks are still down nearly 30% year-to-date because they fell 60% from February 19th through March 23rd. Consumer Discretionary, Financials, Industrials, and Materials all have average gains of more than 50% since March 23rd as well.
The average Tech and Health Care stock is now up year-to-date, while most other sectors have average declines of 3-6% at this point.

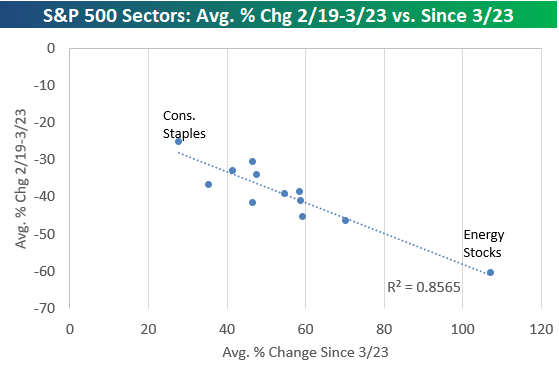
Below is a chart showing the average stock’s gain since March 23rd by sector versus the average stock’s decline from 2/19 through 3/23. In the second chart, we show a scatter plot of the same performance numbers. Basically the sectors that fell the most have rallied back the most, and the ones that fell the least have rallied back the least. The r-squared here is 0.85, which is very high.
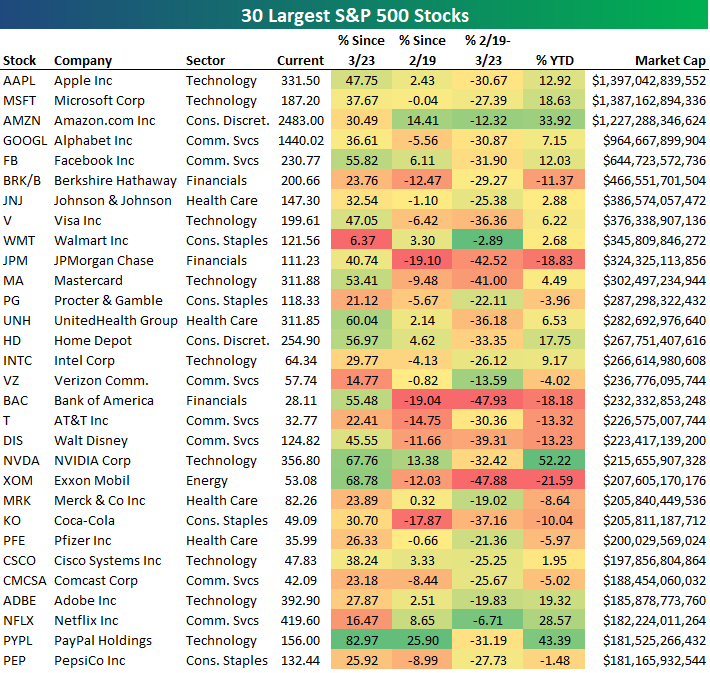
Below is a table showing the recent performance of the 30 largest stocks in the S&P 500. Apple (AAPL) is back on top with a market cap that’s $10 billion more than Microsoft (MSFT), while Amazon (AMZN) ranks third at $1.227 trillion. Alphabet (GOOGL) is back up 7.15% on the year which leaves its market cap only $35.5 billion away from the “trillion-dollar club.”
The biggest winners YTD on this list are Amazon (AMZN), NVIDIA (NVDA), Netflix (NFLX), and PayPal (PYPL). PayPal is now the 29th largest stock in the S&P with a market cap of $181.5 billion.
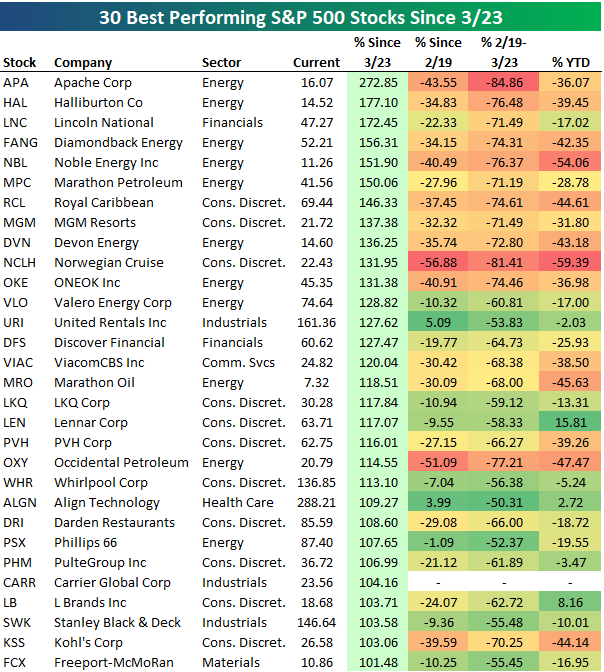
Below is a list of the 30 best performing S&P 500 stocks since the 3/23 closing low for the index. As shown, all 30 stocks are up more than 100%, with Apache (APA) up the most at 272.85%. Halliburton (HAL) is up the 2nd most at +177%, followed by Lincoln National (LNC) at +172.45%. APA is still down 36% YTD, while HAL is down 39.45% and LNC is down 17%.
While there are many stocks on the list that are still down significantly year-to-date, there are others like Lennar (LEN), Align Tech (ALGN), and L Brands (LB) that are now up YTD after rallying more than 100% since 3/23.
All 30 of these stocks were down more than 50% from 2/19 to 3/23 as well.
Below are the 30 S&P 500 stocks that are now up the most on a year-to-date basis. These stocks are all up more than 23% YTD, with DexCom (DXCM) leading the way at +66.55%. Regeneron (REGN), NVIDIA (NVDA), ABIOMED (ABMD), and PayPal (PYPL) round out the top five with gains of more than 43%. Other notables on the list of 2020’s biggest winners include ServiceNow (NOW), eBay (EBAY), Old Dominion Freight (ODFL), Amazon (AMZN), Netflix (NFLX), Clorox (CLX), and Domino’s Pizza (DPZ). Click here to view Bespoke’s membership options for or best research available.

Bespoke Brunch Reads: 6/7/20
Welcome to Bespoke Brunch Reads — a linkfest of the favorite things we read over the past week. The links are mostly market related, but there are some other interesting subjects covered as well. We hope you enjoy the food for thought as a supplement to the research we provide you during the week.
While you’re here, join Bespoke Premium for 3 months for just $95 with our 2020 Annual Outlook special offer.
Current Events
How Big is the Racial Wealth Gap? by Nick Maggiulli (Of Dollars And Data)
Some detailed data on the yawning gap between the wealth of white and black America, and how those gaps transcend any effort to adjust for different circumstances. [Link]
Hedonometer (Vermont Complex Systems Center)
The combination of a viral pandemic, economic collapse, and massive civic unrest fueled by the murder of George Floyd and further police brutality sent national mood plunging to unprecedented lows as measured by sentiment on Twitter. [Link]
Snake Oil
A mysterious company’s coronavirus papers in top medical journals may be unraveling by Kelly Servick and Martin Enserink (Science)
A study credited with debunking the use of hydroxychloroquine used data that may not be legitimate, and its collapse has re-opened debate about the use of the drug as a treatment for COVID-19. [Link]
Top journal retracts study claiming masks ineffective in preventing COVID-19 spread (Retraction Watch)
A study that argued masks didn’t help contain the transmission of COVID-19 has been pulled after major failures in methodology. [Link]
Long & Short Tails
COVID-19 Can Last for Several Months by Ed Yong (The Atlantic)
An investigation of the minority of COVID-19 victims who suffer persistent, long-term side effects from the disease that linger long after the acute dangers of the virus pass. [Link]
No new COVID-19 cases from Lake of the Ozarks crowds, Missouri health director says by Michele Munz (St. Louis Post-Dispatch)
Memorial Day crowds at the Lake of the Ozarks drew lots of attention as possible superspreader events, but there has been no subsequent surge in cases following the revelry. [Link]
Education
Is It Safe to Reopen Schools? These Countries Say Yes by Bojan Pancevski and Naja Dandanell (WSJ)
COVID-19 transmission rates have not surged in some countries that have re-opened schools. Weather may be a factor, but for now it looks like younger students aren’t big risks for transmission. [Link; paywall]
Summer Camp Kids Are America’s Coronavirus Test Subjects by Katherine Rosman (NYT)
Efforts to make sure that campers can safely enjoy their remote summer excursions have reached a fever pitch. [Link; soft paywall]
The Results Are In for Remote Learning: It Didn’t Work by Tawnell D. Hobbs and Lee Hawkins (WSJ)
Students fell behind as schools across the country shuttered to protect children and their families, one example of the cost associated with various COVID containment policies. [Link; paywall]
Finance Industry
The Buy-Side Trader Is Getting Outsourced in Coronavirus Crisis by Justina Lee (Bloomberg)
With an ever-proliferating range of execution venues and strategies for insuring best levels, buy-side traders are being replaced with middlemen who have direct relationships with the sell side. [Link; soft paywall]
Weird History
Ancient Israelites Used Cannabis as Temple Offering, Study Finds by Ariel David (Haaretz)
Residue on a shrine found at a Tel Arad in the Negev Desert of Israel suggests that Israelite worshippers used marijuana in their ceremonies. [Link]
Last Person to Receive Civil War-Era Pension Dies by Michael M. Phillips (WSJ)
The daughter of a Civil War veteran has passed at the age of 1990. Her father, Mose Triplett, started as a Confederate but defected to the Union. His daughter Irene kept receiving her dad’s pension of $73.13 per month until she passed in North Carolina last week. [Link]
Receipts & Outlays
High-Income Nonfilers Owing Billions of Dollars Are Not Being Worked by the Internal Revenue Service (Treasury Inspector General for Tax Administration)
A new report shows thousands of high-income Americans don’t file taxes and are estimated to owe billions. [Link; 44 page PDF]
Economic Effects of Additional Unemployment Benefits of $600 per Week (CBO)
The Congressional Budget Office estimates that failure to renew special $600 per week benefits offered to current unemployment insurance recipients would reduce growth in 2020, but that work disincentives would reduce employment versus the baseline scenario for both 2020 and 2021. [Link]
Social Media
TikTok becomes political platform ahead of US election by Siddharth Venkataramakrishnan (FT)
Younger Americans are flocking to TikTok and it’s proving fertile ground to develop political messages crafted by specific ideological interest groups. [Link; paywall]
Read Bespoke’s most actionable market research by joining Bespoke Premium today! Get started here.
Have a great weekend!
The Bespoke Report – Up, Up, and Away!
This week’s Bespoke Report newsletter is now available for members.
In a world where talk is increasingly cheap while real action is an endangered species, the equity market has put its money where its mouth is, surging 40%+ in the last 50 trading days capped off with a massive rally this week. This week’s 5% gain marked the third straight week that the S&P 500 was up over 3%. The last time that happened? September 1982. And before that you have to go back to 1940 and then a few other occurrences in the 1930s.
Between the low on March 23rd through Wednesday (6/3) the S&P 500 rallied more than 39%. That’s the strongest 50-day move for the index since 1952 when the US stock market went to the five-day trading week. (Prior to 1952, the NYSE was open on weekends as well, and our historical daily data pre-1952 for the major indices lumps the weekend’s move into Monday’s change. Thus, the 50-trading day rate of change prior to 1952 is not necessarily an apples to apples comparison with the same data post 1952.)
This week’s Bespoke Report covers all this week’s market events and the rally off the March lows to see how they may impact performance going forward. To read the report and access everything else Bespoke’s research platform has to offer, start a two-week free trial to one of our three membership levels. You won’t be disappointed!

