Stocks for the COVID Economy — Update
S&P 500 Sector Performance Numbers
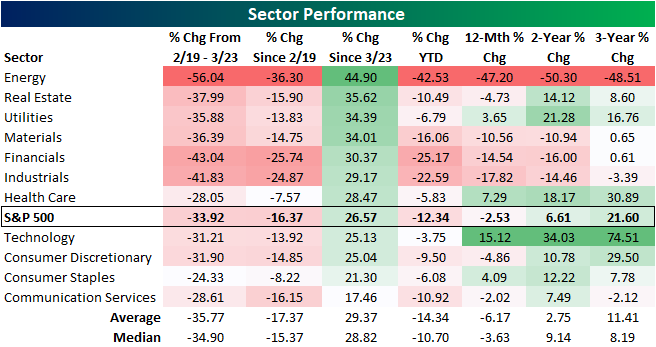
Below is an updated look at the performance of the S&P 500 and its eleven sectors over various time periods. From the S&P 500’s last all time high on February 19th, no sector has been hit as hard as Energy. From those highs for the broader index, the sector had been more than cut in half by the time the S&P 500 found a bottom on March 23rd. In the time since then, Energy has been the best performing sector having risen 44.9%. Meanwhile, some of the best performing sectors over the past few years like Technology and Consumer Discretionary have performed essentially inline with the S&P during this rally. Despite Energy’s outperformance off the 3/23 lows, the sector is still down 36.3% since the S&P 500’s February 19th high and is down even more YTD. Over the past year, two year, and three year period, Energy has also been roughly cut in half.
After the huge rally we’ve seen since March 23rd, there are now four sectors that are back up on a year-over-year basis — Utilities, Health Care, Technology, and Consumer Staples. On a two-year basis, seven of eleven sectors are now back in the green, while only three sectors are now down on a three-year basis (Energy, Industrials, and Communication Services).
The S&P 500 as a whole is now down just 2.53% year-over-year, while it’s up 6.6% over the last two years and up 21.6% over the last three years.
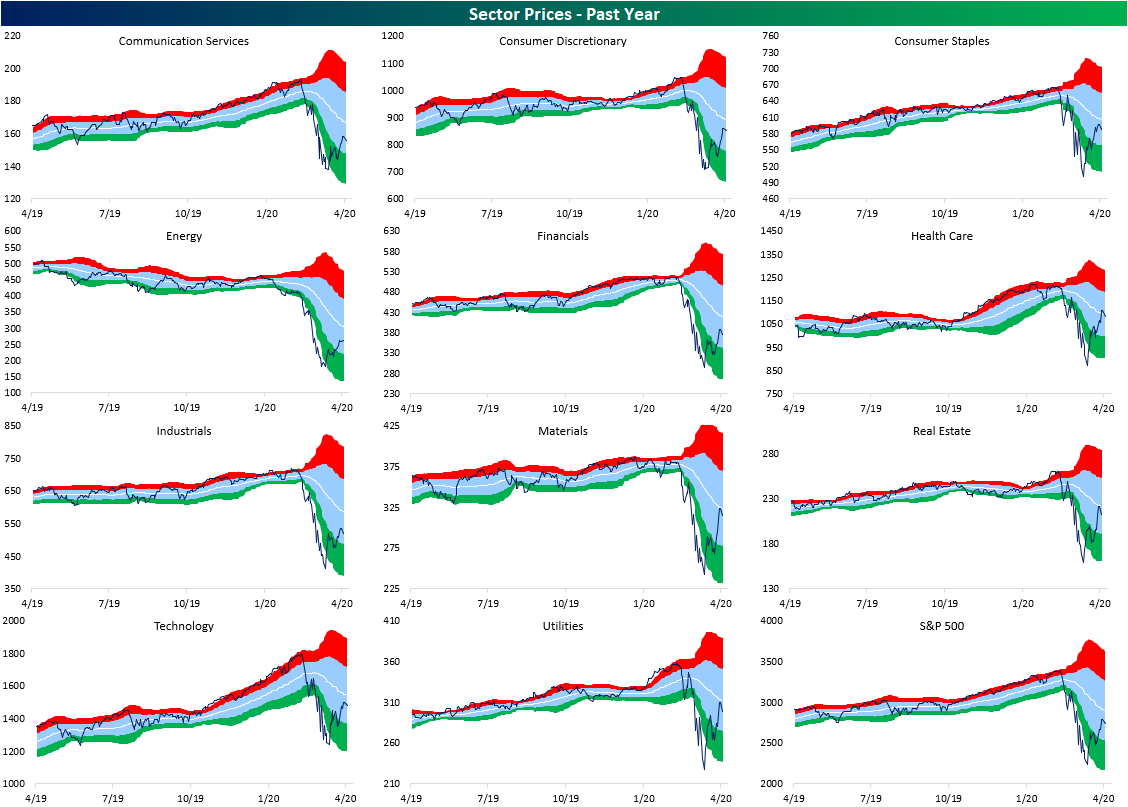
The Covid crash brought most sectors to some form of a multi-year low. But with the significant bounce since 3/23 across sectors, a significant mean reversion has taken place and several sectors are now sitting more in the middle of the past few year’s range as shown in the charts below. Meanwhile, others like Energy, Financials, Industrials, and Materials remain at the lower end of those ranges.
Even on a shorter time frame equities are simply in the middle of their ranges. Last week, the Health Care sector finally crossed back above its 50-DMA; the first sector to do so since the Utilities sector in the first week of March. Today, the Consumer Discretionary, Consumer Staples, Health Care, Materials, and Technology sectors have all done the same but are still within 1% of their 50-DMAs except for Health Care which is 2.5% above.
The S&P 500, Communication Services, Real Estate, and Utilities are only around 2.5 or fewer percentage points away from their 50-DMAs. But for Financials and Industrials, they are still over 8% away. Energy still has the furthest to go currently 13.5% below its 50-DMA. Start a two-week free trial to Bespoke Institutional to access our Sector Snapshot and much more.

Bespoke Stock Scores — 4/14/20
Bespoke’s Morning Lineup – 4/14/20 – Earnings Season Kicks Off With a Thud
See what’s driving market performance around the world in today’s Morning Lineup. Bespoke’s Morning Lineup is the best way to start your trading day. Read it now by starting a two-week free trial to Bespoke Premium. CLICK HERE to learn more and start your free trial.
Earnings season kicked off this morning with JP Morgan (JPM) reporting Q1 results. If first impressions are to be trusted, it could be messy. Of the six companies reporting this morning, three missed EPS forecasts (JP Morgan, Wells Fargo, and Conn’s), two beat EPS forecasts (First Republic and Johnson & Johnson), and one reported inline bottom-line results (Fastenal). This is just the tip of the iceberg, though, as the pace of reports will only pick up going forward. Despite the weakness in results, the one silver lining is that expectations couldn’t be much lower, so that should help to set the bar incredibly low.
Read today’s Bespoke Morning Lineup for a discussion of overnight market events in Asia and Europe, the first batch of US earnings reports, the latest trends and statistics of the COVID-19 outbreak, and other stock-specific news of note.

We’ve talked in the past about how the US and every sector has finally moved out of oversold territory. On a more global scale, we have seen the exact same trend. The image below is from our Trend Analyzer and shows the performance of various international regional ETFs. What’s striking about this chart is how every ETF has not only moved out of oversold territory, but they are also all at nearly the same spot with regards to its trading range. Talk about uniformity!

The Closer – Statecrafting, Retracing Prices, Credit Premiums – 4/13/20
Log-in here if you’re a member with access to the Closer.
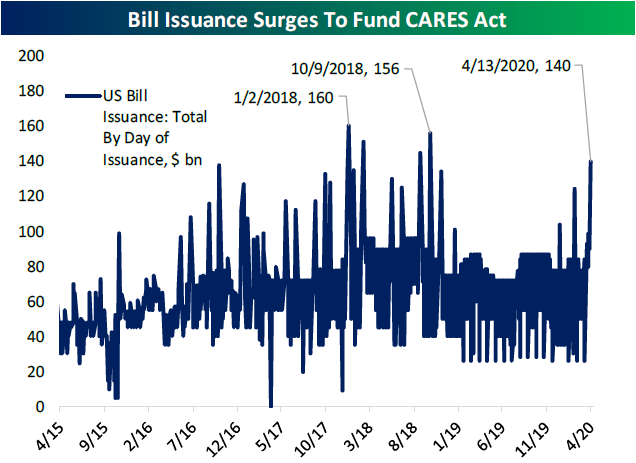
Looking for deeper insight on markets? In tonight’s Closer sent to Bespoke Institutional clients, we begin with the news that several states are beginning to strategize on how to reopen their economies. Next, we turn to several technical developments across the equities space before taking a look at today’s $140 billion of bill issuance. We finish with a look at the massive premiums in the high yield ETF space.
See today’s post-market Closer and everything else Bespoke publishes by starting a 14-day free trial to Bespoke Institutional today!
Daily Sector Snapshot — 4/13/20
Earnings on Deck
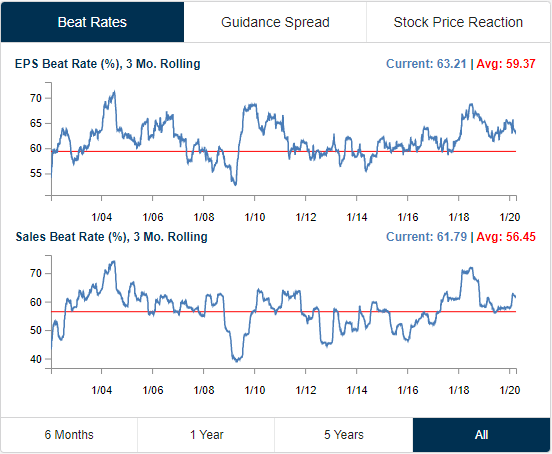
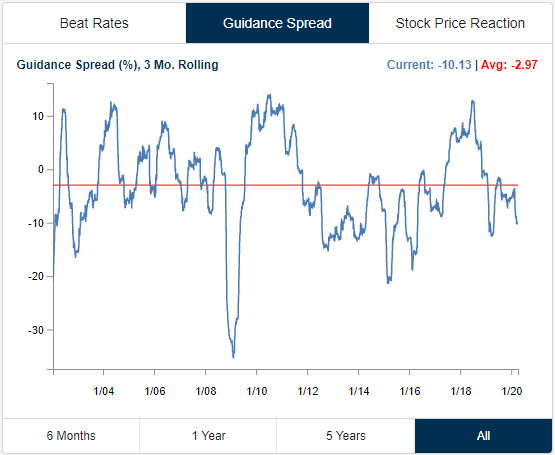
Although there is only one company reporting earnings today, the earnings calendar ramps up this week with a total of 75 other reports through Friday. This upcoming earnings season will be closely watched for how individual companies have been impacted by the COVID-19 pandemic. As shown in the charts from our Earnings Explorer below, although some of the period pre-dates the outbreak and recently the number of companies reporting have been low, 3-month rolling beat rates over the past few months have generally remained positive and above their historical averages. On the other hand, more companies have been lowering than raising guidance. In fact, the guidance spread has been gradually approaching its lowest levels since early 2019.
In terms of stock price reactions, companies have been getting crushed on their earnings reaction days (first trading session after their report). In March, the rolling 3 month 1 day median percent change hit its lowest level since 2012. Granted, part of the reason for that is the sharp declines in February and March regardless of whether or not a company had reported.

In the table below, we show the 30 largest (by market cap) companies scheduled to report earnings through the end of the month. For each stock, we also show their EPS and revenue beat rates, the percentage of time they raise guidance, and then their average one-day performance in reaction to earnings and historical volatility. For volatility, we are simply measuring the average percentage move (up or down) on the day of each earnings report. Johnson and Johnson (JNJ) and Lockheed Martin (LMT) have the strongest EPS beat rates of these companies and Facebook (FB) has topped sales estimates the most consistently. Conversely, Wells Fargo (WFC) has missed EPS the most and NextEra Energy (NEE) has missed sales estimates the most. In terms of stock price reaction, the FANG names—Facebook (FB), Amazon (AMZN), Netflix (NFLX), and Google (GOOG)—have tended to be the most volatile on earnings with NFLX being the most volatile of these averaging a full-day move of 12.5%. While it has been the most volatile, NFLX has not averaged the best performance on earnings. FB holds that title with an average earnings reaction day gain of 2.7%. Bank of America (BAC) on the other hand has averaged the worst performance with a decline of -0.93%. Start a two-week free trial to Bespoke Institutional to access our interactive Earnings Explorer and much more.

Sectors Failing at their 50-Day
In last week’s Sector Snapshot, we noted that each of the eleven sectors as well as the S&P 500 had finally exited oversold territory as shown in the charts below. Even with the major indices down around 2% today, they have held up in neutral territory so far. One interesting thing to note of today’s decline is some sectors are turning lower right as they come within reach of their 50-DMAs.
Over the course of this recent market downturn, Health Care has been the only sector to recently close above its 50-DMA which happened last Wednesday and Thursday. Before that, you would have to go all the way back to March 5th to find a sector above its 50-DMA (Utilities). While Health Care pressed above this average last week, it has failed to hold there with today’s declines bringing it 0.79% below its 50-DMA. Health Care is not alone in failing at its 50-DMA though. Despite having never taken out these levels, the Materials and Real Estate sectors both came within 1% of their averages as of Friday’s close before turning lower today. While they did not get as close, Consumer Staples and Utilities have also failed to press higher after closing within 2% of their 50-DMAs on Friday. That gives evidence that the 50-DMA could be the next technical roadblock for the other sectors as well as the broader S&P 500. Start a two-week free trial to Bespoke Institutional to access our Sector Snapshot and much more.
