Homebuilder Destruction
This morning, the NAHB updated their monthly reading on homebuilder sentiment, and like most other recent economic data, the results were not good. Homebuilder sentiment fell below 50 for the first time since June of 2014 (readings below 50 are considered contractionary). The index plummeted to its lowest reading since June of 2012 falling from 72 in March down to 30 in April.

As shown in the table below, that 42 point decline in just one month was the largest ever recorded in the data going back to 1985. The same can also be said for every one of the sub-indices as well which are now at multi-year lows. That stands in stark contrast to where things were just one month ago. In March, the headline index, as well as several other sub-indices, were in the 95th percentile or better of all readings. In other words, before the COVID-19 pandemic homebuilders’ outlook was historically optimistic.
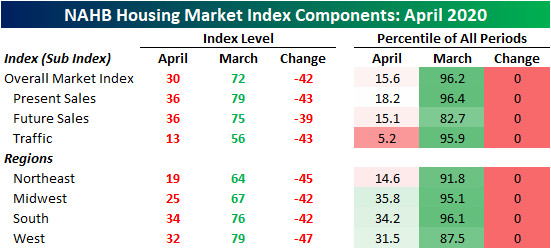
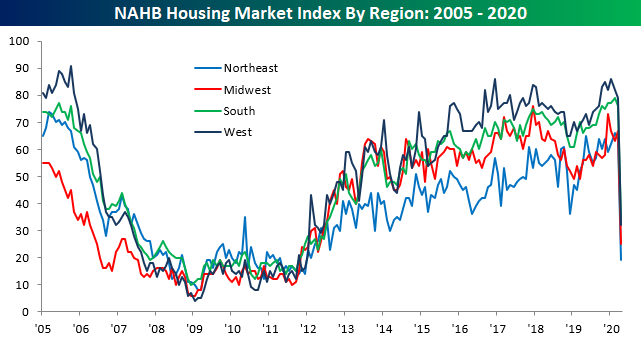
One interesting thing to note in this month’s survey was the declines in homebuilder sentiment were broad across geographic regions but the areas of the country most affected by the virus saw larger declines and are now at lower levels. Namely, sentiment in the Northeast is the lowest of the four regions at 19 compared to the next lowest, 25, in the Midwest. That is as the bulk of US COVID-19 cases can be found in the Northeast, particularly in the tri-state area. Start a two-week free trial to Bespoke Institutional to access our interactive economic indicators monitor and much more.
Retail Sales Chaos
Expectations for this morning’s March Retail Sales report were already low but not low enough. While economists were expecting the headline reading to fall 8.0%, the actual result was even weaker at -8.7%. On the bright side (if you can even say that) readings ex Autos and Ex Autos and Gas were both better than expected.
The overall economic impact of the COVID outbreak is obviously negative, but there have been some big winners (and even bigger losers), and this month’s Retail Sales report illustrated some of these major shifts. Looking through the various sales trends in our monthly update there were some crazy looking charts, but two that especially stood out were Clothing and Food and Beverage Stores. In the case of Clothing, its 50% decline took the monthly sales rate to the lowest level since 1995. Meanwhile, sales at Food and Beverage Stores took off. With people forgoing clothes in favor of food, no wonder everyone is looking like slobs these days!

For anyone with more than a passing interest in how the economic shutdown is impacting economic data, our monthly update on retail sales is a must-read. To see the report, sign up for a monthly Bespoke Premium membership now!
Crumbling Empire
Last month, the New York Fed’s monthly manufacturing index fell to its weakest level since March of 2009. Fast forward one month and the headline reading has collapsed even further and more dramatically for the US region hit hardest by COVID-19. The April reading was forecasted to come in at -35 which would have been the lowest level ever recorded. Instead, it surpassed that by more than two fold coming in at -78.2 and experiencing its largest monthly decline on record in the process. While a net of over three-quarters of the region’s businesses reported declining current conditions, the outlook picked up slightly from last month. Conditions six months out rose to 7 from 1.2 last month.

With expectations and current conditions heading in opposite directions and the index for current conditions reaching such an extreme low, the spread between the two is now at its highest level ever.

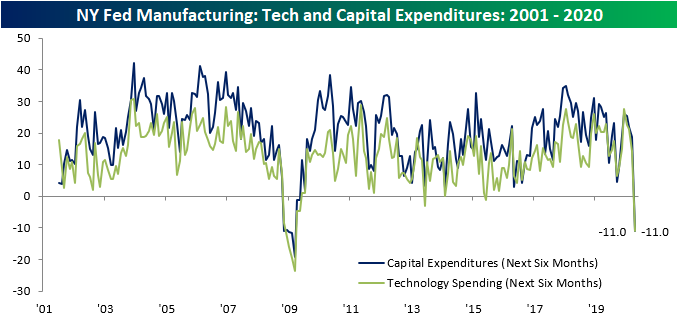
Given the massive decline in the headline number, many of the individual categories of the report were equally as bad. In addition to the headline number, New Orders, Shipments, Number of Employees, and Average Workweek all are at record lows and experienced their largest m/m declines on record. While there were no record lows for the categories on expectations, most of those same ones are around the 1st or 2nd percentile. Additionally, plans for Capital Expenditure and Technology Spending fell by their largest amounts ever.
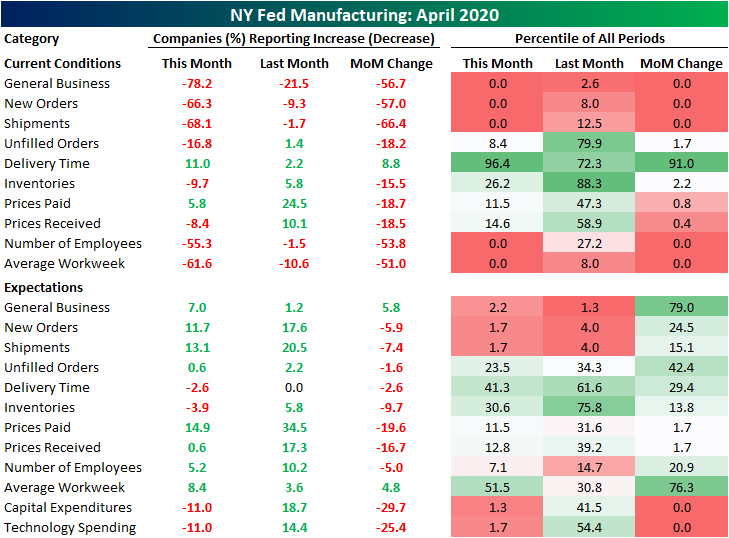
Demand has been in absolute free fall. The indices for both New Orders and Shipments have experienced record declines to record lows; surpassing even those from the last recession. More than half of responding businesses have reported that New Orders and Shipments are weaker. Businesses do not appear to see much light at the end of the tunnel yet either. While not at absolute lows, the readings for New Orders and Shipments six months out are both in the bottom 2nd percentile of all readings and at their lowest levels since the financial crisis.


With business grinding to a halt, it appears focus has shifted from investment to simply staying afloat and cutting costs as the indices for capital expenditure, technology spending, and all tanked. For the first time since June of 2013 for Technology Spending and May of 2009 for Capital Expenditures, the NY Fed indices have tipped negative. Both now stand at -11 indicating fewer companies are looking to expand on capital expenditures or technologies that would benefit operations.
Looking purely at recent jobless claims numbers, the employment side of this month’s Empire Fed report could not be expected to show much strength. This month’s report showed 58.6% of responding employers reporting smaller workforces while only 3.3% saw an increase in employees. Additionally, 64.7% of companies reported lower employee workweeks compared to 3.1% with longer workweeks. Those readings for Number of Employees and Average Workweeks at -55.3 and -61.6, respectively, are both record lows for current conditions. As for expectations six months out, employers do not appear overly optimistic either. Although the reading on average workweek rose to 8.4, which is in the middle of the past few years’ range, expectations for number of employees fell to 5.2 which is its lowest level since August of 2016. Start a two-week free trial to Bespoke Institutional to access our interactive economic indicators monitor and much more.

Chart of the Day: Monster 15-Day Gain
Handful of New 52-Week Highs
With the S&P 500’s rally off of the 3/23 low continuing yesterday, a handful of stocks in the index actually made new 52 week highs! Other than yesterday’s new highs, there are only 19 stocks in the index that have reached a 52 week high at some point since the beginning of March. Regeneron (REGN) was one of the few stocks that rallied in that time frame on hopes that the company would develop a treatment for COVID-19. Other than REGN, stocks in this group seem to be plays on the COVID economy including consumer staples retailers like Walmart (WMT) and Dollar General (DG) as well as plays on Americans staying at home like Netflix (NFLX) and Amazon (AMZN).
With that outperformance during the worst of the sell-off and solid gains since the March 23rd low, most of these stocks are currently mid to high single digits above their February 19th levels except for Regeneron (REGN) and Newmont (NEM) which are 30.94% and 29.72% above, respectively.

As shown in the table above, which can also be seen in the charts from our Chart Scanner below, the COVID collapse that lasted from February into March only resulted in Amazon (AMZN) reaching a 52-week low. AMZN’s 52 week low occurred on March 16th; one week before the rest of the market’s bottom. Every other stock of those that made a new 52-high yesterday saw its 52-week low at some point in 2019.
As shown below, several of these stocks reaching 52-week highs means that they have cleared some form of significant resistance. Dollar General (DG) and Netflix (NFLX), for example, unsuccessfully tested resistance multiple times within the past year before these most recent breakouts. As for trends, each one is currently in a rough uptrend over the past six months to a year putting aside some disruption from the volatility of the recent sell-off. Start a two-week free trial to Bespoke Institutional to access our Chart Scanner and much more.

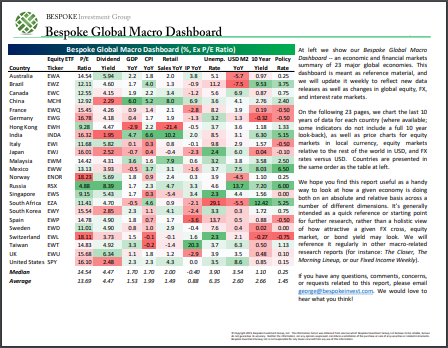
Bespoke’s Global Macro Dashboard — 4/15/20
Bespoke’s Global Macro Dashboard is a high-level summary of 22 major economies from around the world. For each country, we provide charts of local equity market prices, relative performance versus global equities, price to earnings ratios, dividend yields, economic growth, unemployment, retail sales and industrial production growth, inflation, money supply, spot FX performance versus the dollar, policy rate, and ten year local government bond yield interest rates. The report is intended as a tool for both reference and idea generation. It’s clients’ first stop for basic background info on how a given economy is performing, and what issues are driving the narrative for that economy. The dashboard helps you get up to speed on and keep track of the basics for the most important economies around the world, informing starting points for further research and risk management. It’s published weekly every Wednesday at the Bespoke Institutional membership level.
You can access our Global Macro Dashboard by starting a 14-day free trial to Bespoke Institutional now!
Bespoke Morning Lineup – 4/15/20 – A Taxing Day For Oil
See what’s driving market performance around the world in today’s Morning Lineup. Bespoke’s Morning Lineup is the best way to start your trading day. Read it now by starting a two-week free trial to Bespoke Premium. CLICK HERE to learn more and start your free trial.
It’s Tax Day, and while Treasury delayed the deadline for this year, it’s still looking like a taxing day for financial markets as equity futures are indicated to fall over 1% and crude oil is below $20 at its lowest level since early 2002.
We finally got some economic data for this week, and while expectations were already low, the data was even worse. Retail Sales fell 8.7% in March versus expectations for a decline of 8.0%. That was a March number. For April, we got the Empire Manufacturing report, and that was an absolute disaster. Economists were forecasting the headline index to come in at -35.0, which would have been the worst reading in its history dating back to 2001. The actual result was more than twice as bad, though, coming in at a level of -78.2. As negative as that reading is, it’s to be expected when you have a complete shutdown of the US economy.
Read today’s Bespoke Morning Lineup for a discussion of overnight market events in Asia and Europe, the drop in crude oil, details of the airline bailout, the latest major US earnings reports, trends and statistics of the COVID-19 outbreak, and other stock-specific news of note.

This morning’s Retail Sales report was even more interesting in the details which we will discuss more in a report later. But one trend that has completely reversed is that of “Eating In vs Eating Out”. After trending lower for years now, the share of total retail sales taking place at food and beverage stores spiked to 13.53%. Moving in completely the opposite direction, the share of sales at Bars and Restaurants plunged to 10.05%. If you think that was bad, though, keep in mind that the economy wasn’t shut down for all of March. Wait until the April numbers are released.

The Closer – Tech Rules As Markets Roar Higher Into Recession – 4/14/20
Log-in here if you’re a member with access to the Closer.
Looking for deeper insight on markets? In tonight’s Closer sent to Bespoke Institutional clients, we show how stocks are richly valued relative to next year’s earnings estimates. We then take a look at how forecasters are now certain of an imminent recession. We close out tonight by showing Tech’s strength in leading the market higher while grossly outperforming banks which are seeing an uptick in bad debt charges..

See today’s post-market Closer and everything else Bespoke publishes by starting a 14-day free trial to Bespoke Institutional today!