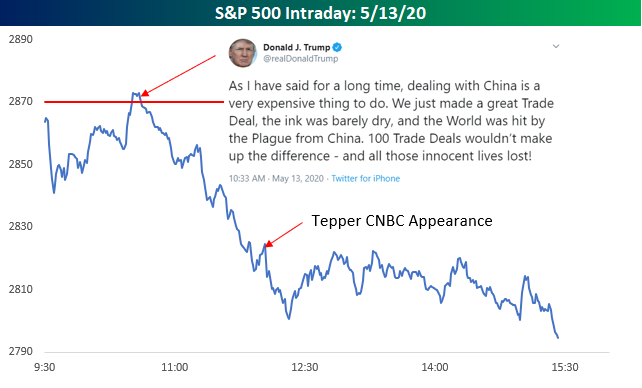
The Trump-Tepper One-Two Punch
What started out as a weak open for equities today started to show improvement early on. Just an hour after the open the S&P 500 was even up for a few minutes, but then the President sent out a tweet where he argued that “dealing with China is a very expensive thing to do.” He then went on to say that “100 Trade Deals wouldn’t make up the difference” for the “Plague from China.” The timing of this tweet was especially concerning as it comes just two days before the expiration of a 90-day enforcement provision of the trade deal on Friday. With that tweet, the equity market’s rally was stopped dead in its tracks as the S&P 500 sold-off for the rest of the morning.
By noon, the market was attempting to bounce, but then David Tepper came on CNBC to say that the current market was one of the most overvalued he has ever seen. That stopped any chance of a rebound and within minutes, the S&P 500 was at its lows of the day. Ever since then, the market has been trading sideways all afternoon, but with 45 minutes left in the trading day, we’ll see if those lunchtime lows can hold. Between Druckenmiller after the close yesterday, Trump this morning, and then Tepper at lunch, you can’t fault the market for acting a little punch drunk. Start a two-week free trial to Bespoke Institutional for full access to our research and interactive tools.
B.I.G. Tips – Caterpillar Sales Plummet
Bull Flag For Gold (GLD)
Over the past year and a half, gold has been on the up and up though it was interrupted by the string of volatility from the recent Covid crash across asset classes. In the past few months, the SPDR Gold Trust ETF (GLD) fell 12.5% from its March 9th high to March 19th low, which was followed by an 18.33% rally off that low to its last closing high on April 23rd.
Since its April high, GLD has been consolidating with a set of higher lows and lower highs between roughly $158 and $163. This is a flag pattern that suggests a breakout is coming either to the upside or the downside. For now it’s closer to breaking out to the upside as it tests the top end of the flag’s range. Start a two-week free trial to Bespoke’s premium research platform to access a full range of equity analysis and interactive tools.

Reversal to Neutral
Currently, the only two sectors that are trading in overbought territory (1+ standard deviations above its 50-DMA) in our Trend Analyzer are Technology and Communication Services. Meanwhile, Financials, Industrials, Utilities and Real Estate are all closer to oversold territory than overbought without any of those sectors yet to have even moved above their 50-DMAs.
As for short-term breadth levels as measured by the 10-day advance/decline line, as shown in the charts from our Daily Sector Snapshot below, those same sectors in addition to Consumer Discretionary and Materials have actually begun to touch oversold levels after the late day reversal lower yesterday and a lack of a push higher with lackluster breadth over the prior few days.
Even the sectors that have been market leaders like Health Care, Communication Services, and Tech have more neutral 10-day A/D line readings at the moment even with prices at or near overbought levels. Start a two-week free trial to Bespoke Institutional to access our Daily and Weekly Sector Snapshots and much more.

Some Stocks Moving Above February Highs
In last night’s Closer, we noted that as of yesterday’s close, the S&P 500 (SPY) sat over 15% away from its 2/19 all time high. But as for the index’s individual stocks, about 12.4% have retaken their 2/19 levels. As shown in the chart below, Health Care sector stocks on average are the closest at 5.29% below their levels on 2/19. Consumer Staples are the only other stocks that are less than 10% away from those levels on an average basis. Conversely, Energy, Financials, and Real Estate have the furthest to go, all down around 30% or more.
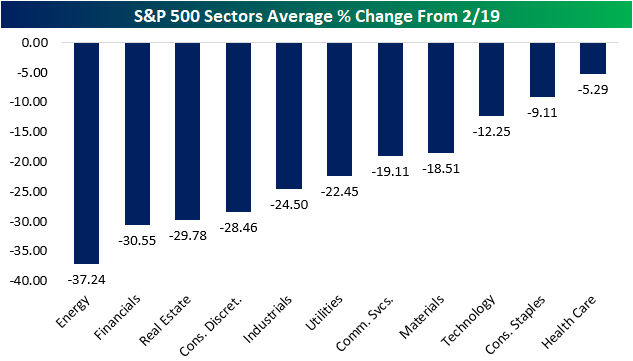
Meanwhile taking a look across industries, there is only one group of stocks that’s currently above its 2/19 levels on an average basis: Pharmaceuticals, Biotechnology, & Life Sciences. While stocks of that industry have pushed above by 1.2% on average, the other groups are not even close with the next closest to doing so being Food & Staples Retailing at 7.6% below 2/19 levels. In addition to Food & Staples Retailing, Food, Beverage, & Tobacco, and Health Care Equipment & Services are the only others that are even within 10% away. On the other end of the spectrum, Banks, Energy, and Consumer Durables & Apparel are down the most.

Those same dynamics can be seen in the table below of the stocks furthest above and below their 2/19 levels. While Health Care stocks like Dexcom (DXCM) and Regeneron (REGN) have surged over 40% since 2/19, some of the biggest losers during the sell off remain beaten down. Of the 20 stocks that are furthest below their 2/19 levels, most have something to do with oil, planes, cruises, or retail stores. Start a two-week free trial to Bespoke Institutional to access our Closer and much more.

Bespoke’s Morning Lineup – 5/13/20 – Last Hour Implications
See what’s driving market performance around the world in today’s Morning Lineup. Bespoke’s Morning Lineup is the best way to start your trading day. Read it now by starting a two-week free trial to Bespoke Premium. CLICK HERE to learn more and start your free trial.
After a sharp sell-off in the final hour of trading yesterday, US futures were tentatively higher this morning but have just dipped into negative territory. There haven’t been a lot of major headlines so far, but Fed Chair Powell’s 9 AM speech where he is expected to push back on negative interest rates will lately make headlines. PPI was just released and came in much weaker than expected with headline falling 1.3% m/m (expectations -0.5%) and the core reading dropping 0.3% (expectations unchanged).
Be sure to check out today’s Morning Lineup for a rundown of the latest stock-specific news of note, UK GDP, the latest global and national trends related to the COVID-19 outbreak, and much more.

Equities were already weak heading into the last hour of trading yesterday but got much weaker in the final sixty minutes of trading. With a decline of 1.51% in the final hour, it was the S&P 500’s worst last hour performance since March 27th, just a few days after the March low.
So, what is the short-term takeaway of a sharp sell-off to end the day? Is it positive or ominous? Based on recent history, it’s neither. Of the eight prior 1% declines in the last hour of trading, the S&P 500 has traded higher the following day four times and lower the other four. At least today will break the tie! With average and median gains that are both over 1%, though, the magnitude of the positive days did outweigh the negatives.

Daily Sector Snapshot — 5/12/20
B.I.G. Tips — Post-Covid Earnings Triple Plays
Here at Bespoke, our job is to identify winners and losers, and one of the ways we try to find earnings-season winners is through our list of “triple plays.”
Long-term Bespoke subscribers know how much we like earnings triple plays, but for those that haven’t heard of the term, we came up with it back in the mid-2000s to identify stocks that report earnings and beat EPS estimates, beat revenue estimates, and raise guidance. Beating estimates for Q1 doesn’t tell us much given that the Covid lockdowns didn’t fully take hold until the 2nd half of the last month of Q1, but for a company to beat estimates in Q1 and also raise forward guidance in this environment is pretty impressive. There have actually been 44 earnings triple plays this season, and we provide a full list of these triple plays in our newest report.
See our Earnings Season Triple Plays by signing up for a Bespoke Interactive membership now. Click this link for a 60-day free trial!
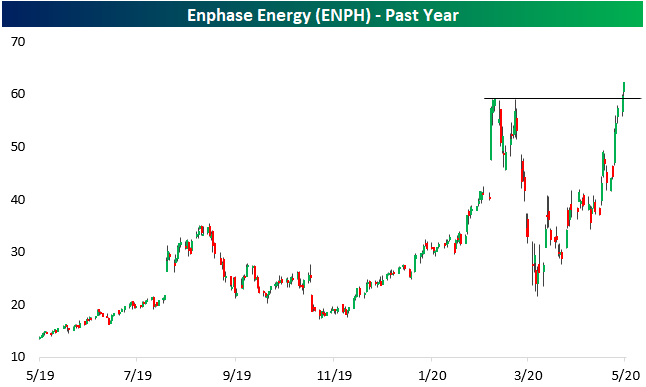
Solar Dramatically Outshining Oil
Over the past several weeks, two of the more significant trends have been the collapse in crude oil prices and the outperformance of momentum names that we have made note of multiple times in the past week (see The Closer from last night and last Thursday). One area that there is some cross over of these two trends is with renewable energy stocks. These stocks related to oil alternatives have certainly had momentum behind them recently. Since its March 23rd low, the Solar ETF (TAN) has been in a steady uptrend gaining 47.16%. Meanwhile in the land of fossil fuels, the crude oil ETF (USO) is down nearly the same amount since March 23rd (-46%) even though at the moment it is around 25% off its lows on April 28th. With USO still beaten down and TAN continuing to rally, the ratio between the two has gone vertical (second chart below) meaning TAN has been outperforming USO by its widest margin since it first began trading in 2008.

Also notable today is TAN’s largest holding: Enphase Energy (ENPH). Last week, ENPH reported a solid quarter in which the company beat EPS and sales estimates, but lowered guidance. Despite that lowered guidance, snapping a streak of four straight Triple Plays, the stock popped 18.73% and it has continued to rally through today. Between yesterday and today’s gains, the stock is breaking out from its February highs. Start a two-week free trial to Bespoke Institutional to access our Chart Scanner, Earnings, Explorer, and much more.