B.I.G. Tips – FANG Chomping at the Bit of Record Highs
Bond ETFs Break Out
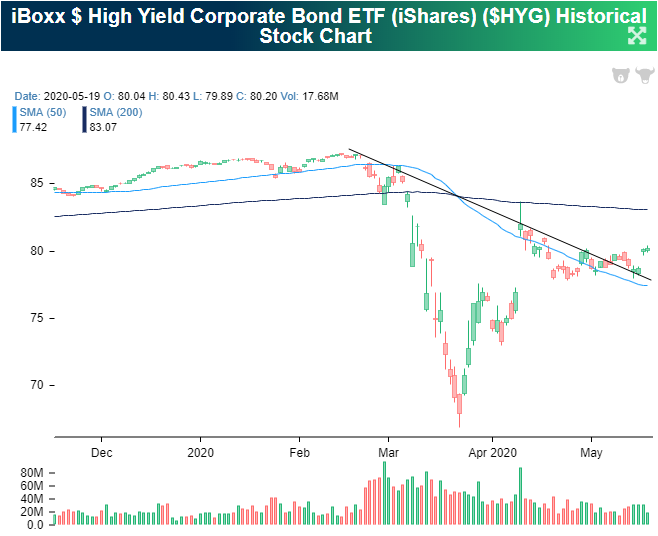
Over the past few days, there have been some notable breakouts for some of the largest fixed-income ETFs. The High Yield Corporate Bond ETF (HYG) currently is only in the middle of its range that has been in place since early April. In the past couple of weeks, HYG broke above the downtrend line off its pre-COVID highs, but. In the past few sessions, it has successfully retested that downtrend line before surging higher this week.
As for investment-grade corporate bonds (LQD), after reaching a new high on March 6th, the ETF plummeted over 21% through March 19th but quickly recovered much of those losses and was within two percentage points of that prior high as soon as April 9th. It never quite reached those levels, though, and had been in a downtrend since then. After successfully testing support at its 200-DMA last Monday, a day before the Fed’s corporate bond ETF buying program began, LQD has consistently been on the rise and is breaking above that downtrend this week.

Action by the Fed definitely played a role in alleviating issues in the corporate bond space, but for municipal bonds the aid has been slower to come. The Fed’s announced facility for munis is not projected to be fully up and running until the end of the month. Despite that, the Muni Bond ETF (MUB) is also eyeing a breakout above its mid-April high.

While all of these ETFs are breaking out, their performance since March 23rd when the equity market found a bottom and the Fed announced corporate credit facilities has varied a bit. HYG and LQD managed to rise 16.86% and 12.87%, respectively, as of yesterday’s close. Meanwhile, without the same central bank aid up until more recently, MUB has underperformed only rising 9.2% as shown below.

Credit spreads echo the outperformance of corporates. Again since 3/23, corporate credit has been rallying versus UST, but the opposite holds true when it comes to munis as spreads have been consistently on the rise in that same time frame. Start a two-week free trial to Bespoke Institutional to access our Fixed Income Weekly and much more.

Lowe’s (LOW) Close to New Highs
Home improvement retailer Lowe’s (LOW) reported quarterly earnings this morning and blew away numbers. EPS came in at $1.77 versus a consensus estimate of $1.32, while revenues came in at $19.675 billion versus a consensus estimate of $18.28 billion. In pre-market trading, LOW is up 5.7%, and shares are within $3 of all-time highs that were made on February 20th (one day after the S&P 500 peaked).
The price chart of Lowe’s is one to behold, and it really makes you wonder how “the market” could have gotten it so wrong. Prior to the stock’s collapse at the height of the COVID scare, it had been in a strong, long-term uptrend. LOW last reported earnings on February 26th, just a few trading days after its last all-time high was made. In between today’s earnings report and its last earnings report three months ago, the stock experienced a 48% decline — essentially cut in half — followed by a 90% rally. During its 48% rout in less than a month, investors certainly weren’t thinking that LOW would turn out to be a huge winner from the COVID lockdowns. But just as quickly as it declined, the stock surged back as more investors realized that lockdowns and stay at home orders meant consumers would use the period to do all the things around the house that had been put off over the years. It also helped that most residential construction projects were not put on hold throughout the lockdowns, and that home improvement was one of the few “lucky” areas in retail that was deemed “essential.” Start a two-week free trial to one of Bespoke’s premium research memberships for our best market anaysis.

Bespoke’s Morning Lineup – 5/20/20 – That Was Quick
See what’s driving market performance around the world in today’s Morning Lineup. Bespoke’s Morning Lineup is the best way to start your trading day. Read it now by starting a two-week free trial to Bespoke Premium. CLICK HERE to learn more and start your free trial.
No sooner than the S&P 500 saw a disheartening sell-off to close out the day on Tuesday, futures are indicating a strong open this morning which would essentially erase all of the declines from the last hour yesterday. In our just-published Chart of the Day, we looked at prior periods where the S&P 500 declined 0.75% or more in the last half hour of one day only to rally 0.75%+ in the first 15 minutes of the following day. Today’s reversal also marks the 5th time this year that we have seen this type of reversal. Check out the entire report by signing up today.
Be sure to check out today’s Morning Lineup for a rundown of the latest stock-specific news of note, earnings from some of the nation’s largest retailers, the latest global and national trends related to the COVID-19 outbreak, and much more.

Sell in May? Maybe not yet. The image below is from our interactive Seasonality tool and shows the S&P 500’s median performance over the next week, month, and three months based on historical returns over the last ten years. Historically, the S&P 500 has seen a median gain of 0.87% from the close on 5/20 through 5/27 which ranks in the 80th percentile of all one-week periods throughout the year. For the next month, the median return increases to 2.42% which ranks in the 84th percentile. While short-term returns have been solid, the S&P 500’s median return from the close on 5/20 through 8/20 has been a gain of 1.97% which ranks in just the 38th percentile. Maybe it’s better to wait until June.

Chart of the Day – Gaps Higher After Late Day Sell-Offs
Daily Sector Snapshot — 5/19/20
Bespoke Stock Scores — 5/19/20
Chart of the Day – Rally Hits the 40-Day Mark
Relative Strength Bouncing
A couple of weeks ago, we highlighted how the Tech sector has been the only sector whose relative strength has been in a strong uptrend for the entirety of the past year meaning it has outperformed the S&P 500. That is still very much the case, but other sectors have shown some interesting patterns.
Energy has gotten a lot of attention over the past several months for how badly it was beaten down during the bear market and crude oil’s rout a little later. Despite that, it has actually outperformed the S&P 500 with its relative strength line rising since mid-March. Part of the reason for this is it has been more volatile, so the gains have been larger than other sectors while it is also still down substantially more YTD than other sectors. Materials is another laggard that seems to have seen its relative strength line versus the S&P 500 bottom roughly around the same time.
While those two sectors have turned things around by this measure, Financials and Industrials have found little respite. Both sectors have seen a continued grind lower in their relative strength. Consumer Staples, Utilities, and Real Estate are in a similar boat after these defensive sectors saw their outperformance begin to subside as the market rebounded. Start a two-week free trial to Bespoke Institutional to access our Daily Sector Snapshot and much more.

50-DMAs in the Rearview
With equities continuing to rally, more and more stocks have been moving above their 50-DMAs. As of yesterday’s close, 81.78% of stocks in the S&P 500 closed above their 50-DMAs. That is the highest reading since January 17th of this year. That’s a pretty impressive reading. For example, even at the February 19th all-time high the reading wasn’t this high! As for the individual sectors, Consumer Discretionary, Health Care, Financials, Industrials, Real Estate, Technology, and Utilities are all at their highest level by this measure since the start of the bear market. While not necessarily at new highs, the other sectors are similarly around some of their strongest readings of the past few months.

For most of the new bull market, Health Care has been a leader in having the largest share of stocks above their 50-DMAs. The current reading for the sector remains at an impressive 98%. Meanwhile, one market leader and one market laggard, Technology and Energy, also boast more than 90% of stocks above their 50-DMAs. On the other end of the spectrum, Real Estate is the only group with less than half of its stocks below their 50-DMA. Utilities is similarly weak with only a little more than half of its components above their respective moving averages. Rounding out the bottom three, Financials is the only other sector with less than three-quarters of its stocks above its moving averages. Start a two-week free trial to Bespoke Institutional to access our Sector Snapshot and much more.
