Daily Sector Snapshot — 5/29/20
May’s Top Performing Stocks
After an absolutely amazing April, traders were in no mood to sell this May. Within the Russell 1000, which tracks the 1,000 largest US stocks by market cap, the index’s components rallied an average of 5.3% with just over 70% of the index’s components trading up during the month. In the table below, we highlight some of the biggest winners. Some of these names may sound familiar, but there are bound to be a few that you’ve never heard of.
This month, three stocks in the Russell 1000 gained more than 50%. The best of those three was Twilio (TWLO). After closing out April at a price of $112.3, the stock rallied 73% to just shy of $200 per share. So far in 2020, TWLO has almost doubled. Not familiar with TWLO? The company creates a number of APIs that enable voice, video, and messaging capabilities to their platforms. So when you get a text from UBER telling you that your car is on its way, that message is likely powered by TWLO’s software.
Looking through the list of this month’s winners, like TWLO, a large share of the stocks listed come from the Technology sector. Of the 34 names on the list, 14 are form the Tech sector, and the next closest sector – Consumer Discretionary – has just seven stocks on the list. The top-performing stock from the Consumer Discretionary sector has been Wayfair (W), which has gained nearly 38%. Apparently, after being stuck at home for the last several weeks, many Americans have decided they need some new furniture.
In total, eight of the eleven GICS sectors are represented on the list. The only sectors not making the cut? Financials, Real Estate, and Utilities. Maybe next month. Start a two-week free trial to Bespoke Institutional for full access to our research and interactive tools.

Bespoke Matrix of Economic Indicators – 5/29/20
Our Matrix of Economic Indicators is the perfect summary analysis of the US economy. We combine trends across the dozens and dozens of economic indicators in various categories like manufacturing, employment, housing, the consumer, and inflation to provide a directional overview of the economy.
To access our newest Matrix of Economic Indicators, start a two-week free trial to either Bespoke Premium or Bespoke Institutional now!

Most Stocks Above Their 50-DMAs Since 1991
As we noted in yesterday’s Sector Snapshot, if you were to pick out any one stock in the S&P 500, odds are it would be above its 50-DMA. Currently, 96.24% of S&P 500 stocks are above their 50-DMAs. On a sector basis, Consumer Discretionary, Energy, Industrials, and Materials all have 100% of their stocks above their 50-DMAs. That is a huge share of the index sitting above their 50-DMAs at once. As shown in the chart below, times in which there have been this many stocks above their 50-DMAs have been few and far between. Of all days since the start of 1990, there have only been four other days with a reading as high or higher than the current 96.24%. The most recent of these was March 5th, 1991 when 96.59% of the index was above its 50-DMA. Other than that, only February 11th through 13th of that same year saw these types of readings (97.4%, 96.6%, and 97.8%, respectively). Start a two-week free trial to Bespoke Institutional to access our Sector Snapshots and much more.

Bespoke’s Morning Lineup – 5/29/20 – So Much For a Slow Friday
See what’s driving market performance around the world in today’s Morning Lineup. Bespoke’s Morning Lineup is the best way to start your trading day. Read it now by starting a two-week free trial to Bespoke Premium. CLICK HERE to learn more and start your free trial.
Futures are only modestly lower this morning, but that’s not for a lack of negative headlines. Between the conflict with China, the fight between Twitter and the President, and protests and disorder in Minneapolis, there’s no shortage of cross currents.
Be sure to check out today’s Morning Lineup for a rundown of the latest stock-specific news of note, news in global markets, global and national trends related to the COVID-19 outbreak, and much more.

This morning, we wanted to provide a quick update on market breadth to close out the week. Ever since the peak in February, breadth and prices had been tracking each other pretty closely, although breadth has been lagging price a bit off the lows. After several short-term highs where breadth didn’t confirm the high, though, on Wednesday, the cumulative A/D line for the S&P 500 finally confirmed the rally in prices with a post 3/23 high.

Bespoke’s Weekly Sector Snapshot — 5/28/20
Seasonal Winds Shifting
In the interactive section of our website, one of the features included is the Stock Seasonality Tool.

The Seasonality Tool allows users to monitor seasonal trends for US equities and other asset classes throughout the calendar year. One feature of the tool allows users to screen for which stocks and ETFs have historically performed the best and worst over the last ten years during periods with start and end dates that the user can set. Another feature of the Seasonality Tool are the gauges below that show the S&P 500’s median one-week, one-month, and three-month return over the last ten years from the close on the current date. In each gauge, we also show how each period’s performance stacks up on a percentile basis relative to all other periods within the calendar year.
The gauges below are from the Stock Seasonality Tool for today (5/28). Looking at historical returns going forward from today, the results aren’t particularly attractive. Over the last ten years, the S&P 500’s median one week return from the close on 5/28 has been a decline of 0.59% which ranks in just the 11th percentile of all one-week periods. Over the following month, the median decline of 0.85% is even worse and ranks in only the 7th percentile. For the following three months, the S&P 500’s median performance flips back to positive territory, but at less than +2% still only ranks in the 37th percentile. This year most certainly has not been a year to sell in May, but if seasonal trends are any indication, don’t be surprised to see a June swoon. Start a two-week free trial to Bespoke Institutional to access all of our interactive tools and analysis.

Weekly Sentiment Indicators Improving
Investors and newsletter writers are finally seeming to be convinced by the rally as the S&P 500 has retaken its 200-DMA over the past week. 33.07% of respondents in AAII’s weekly sentiment survey reported as bullish this week. That is up from 29% last week and the highest level of bullish sentiment since April 16th when it reached 34.86%.

As for bearish sentiment, after the 1.17 percentage point decline to 42.13% this week, AAII’s survey is reading the lowest level of bearish sentiment since mid-April. This week was the third consecutive week with bearish sentiment declining, but despite that it is still fairly elevated. In fact, this week marked the twelfth consecutive week in which bearish sentiment was at least one standard deviation above it historical average (30.48%). That is the longest such streak since a 14-week long streak in 2008.

Finally, neutral sentiment in the AAII survey fell for a second week in a row. Currently at 24.8%, it remains at a much lower level than has been the norm for the past several years (over the past decade it has averaged a reading of 33.76%) but also well off of its late March low of 14.5%. Start a two-week free trial to Bespoke Institutional to access our interactive economic indicators monitor and much more.

Fund Flows Still Show Little Equities Enthusiasm
The table below gives a summary of mutual and exchange-traded fund flows as compiled by the Investment Company Institute for the week ending May 20th.
Equity fund flows remain negative. While there’s been lots of anecdotal evidence of retail enthusiasm in the equity market, fund flows are a very different story. This week was relatively modest, with equity fund outflows in the bottom 6% of all readings across mutual funds and ETFs. That totals $13.7bn of AUM out the door, with the worst hits coming for global funds which saw flows in the bottom 3% of all readings. The last 3 months and year have been the worst on record for aggregate equity fund flows across mutual funds and ETFs, and the worst three months on record for world equity funds. ETFs tracking equities have not seen large inflows but they are also not suffering the same kind of outflows as mutual funds.
Commodity funds and bond funds are a totally different story. The last three months have been the best on record for commodity fund inflows, while bond funds have seen readings in the top 3% of all periods for the last week and month; recent commodity fund flows are slightly cooler than their record pace of the last three months but are very, very strong nonetheless. Start a two-week free trial to Bespoke Institutional to access our full research platform and our unique investor tools.

Texas Activity Starting To Recover
Yesterday the Dallas Fed released monthly activity surveys for the services and retail sectors in May. These surveys are similar to PMIs, with readings above zero indicating more respondents seeing improvement than those seeing declines, and vice-versa. Looking at revenue first, Services businesses reported much less widespread revenue declines than in April. As a reminder, though, a reading below zero still indicates revenue declines, so the May reading still indicates widespread drops in Services spending; that said, the outlook has bounced back into positive territory, which is a great sign.
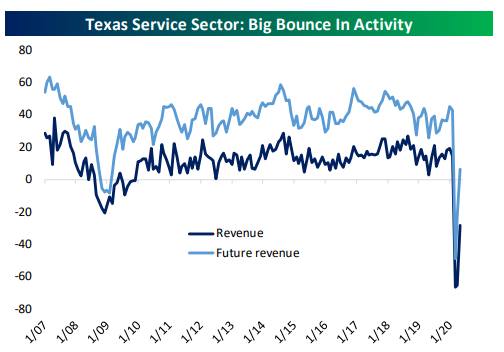
Retail businesses specifically have seen an even bigger bounce in revenues that brings that state’s retail sector to almost zero revenue declines in May. Retail businesses report an even more dramatic reading for future revenue expectations, with the series in totally normal territory at this point.

Finally, we note that while revenues look to be firming up, employment is still dropping and there isn’t a big surge in re-hiring yet for services businesses. The company outlook category, despite having half of its drop reversed, is still about where it was at the lows of the last recession. Start a two-week free trial to Bespoke Institutional to access our full research platform and our unique investor tools.
