Bespoke’s Morning Lineup – 7/1/20 – Slow Start to the New Quarter
See what’s driving market performance around the world in today’s Morning Lineup. Bespoke’s Morning Lineup is the best way to start your trading day. Read it now by starting a two-week free trial to Bespoke Premium. CLICK HERE to learn more and start your free trial.
It’s a new quarter for the market, and investors appear to be suffering a bit of a hangover after last quarter’s big gains. ADP Private Payrolls were just released and came in weaker than expected (2.369 million vs 2.900 million). In any other environment, a miss of over half a million payrolls relative to expectations would have been newsworthy by itself, but when you’re dealing in millions, what’s a few hundred thousand between friends?
Be sure to check out today’s Morning Lineup for a rundown of the latest stock-specific news of note, PMI Manufacturing data for June, global and national trends related to the COVID-19 outbreak, and much more.

When we first started putting the table below together this morning, SPY was indicated to open down by over half of one percent, but as of now, the margin of decline has been cut in half. Therefore, we have expanded the table to show all days where SPY opened a new quarter with a downside gap of 0.25% or more. Time will tell, but by the time the opening bell rings, we may not even be at that level.
While first impressions in these quarters weren’t very good, SPY’s performance from the open to close tended to be positive with an average gain of 0.38% (median: 0.42%) and positive returns over 70% of the time. For the rest of the quarter, performance was even better as the SPY averaged a gain of 5.40% (median: 6.94%) with gains over 80% of the time. Also, keep in mind that the largest downside gap to open a quarter was last quarter on April 1st when SPY gapped down over 3.5%. That certainly ended up being an April Fools’ joke as SPY rallied more than 25% from the close on 4/1 through yesterday’s close.

Daily Sector Snapshot — 6/30/20
B.I.G. Tips – Huge Quarterly Gains; July Seasonality
“Hodl” Off For Now
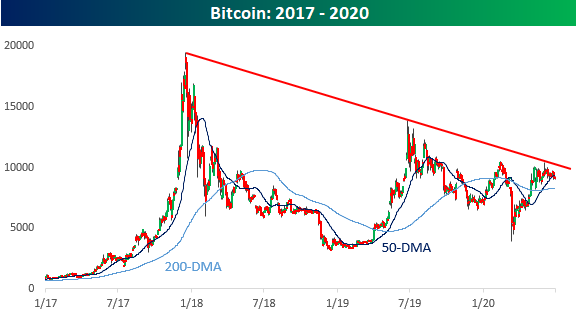
Unless we’re talking about long-term US treasuries which were modestly lower in Q2, just about every other asset class was higher. Among those, bitcoin was no exception. During Q2 alone, bitcoin was up slightly more than 40%, which is impressive even for a volatile asset class like cryptocurrencies. While bitcoin’s performance was very strong, though, closing out the quarter, there was a feeling of disappointment that it didn’t finish off the quarter even stronger.
Two things left bitcoin ‘hodlers’ looking for more. First, while the price briefly eclipsed $10,000 during the quarter, it wasn’t quite enough to take out the highs from February. Second, from a longer-term perspective, the intraday high of ~$10,400 on June 4th coincided nearly perfectly with bitcoin’s downtrend line from its record high back in late 2017 when crypto was all the rage. Until bitcoin can take out either its downtrend or make new highs for the year, investors may be best served to wait on the sidelines. Click here to view Bespoke’s premium membership options for our best research available.
Nasdaq to Russell 2,000 Ratio
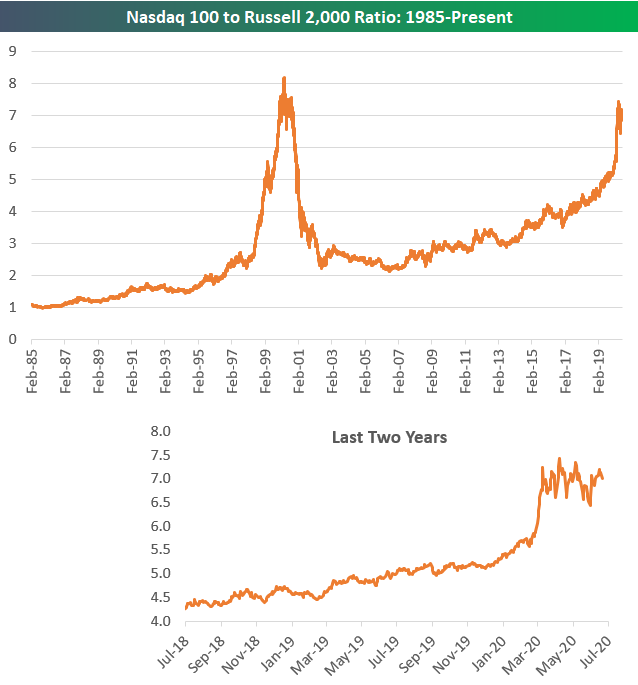
Last week we compared the recent performance of the Nasdaq to the small-cap Russell 2,000. Below is a look at the relative strength between the Nasdaq 100 and the Russell 2,000. The chart shows the ratio of the Nasdaq 100 to the Russell 2,000 since 1985. In the late 90s, the Nasdaq soared versus the Russell, with the ratio rising from 1:1 in the mid-80s up to 8+ at the peak of the Dot Com bubble. The ratio came crashing back down to the low 2s in the mid-2000s, but it has been on a steep upward trajectory for the last 12 years.
Over the first two months of 2020, with small-caps underperforming and the Nasdaq outperforming, the ratio spiked more than two points from ~5 up to 7.5 at its recent peak. We’d note, however, that since the Covid Crisis hit, we’ve seen the ratio trade sideways in what looks to be a peak for the time being. One day small-caps will have their day in the sun again, it’s just a matter of how long it takes for that to happen. Click here to view Bespoke’s premium membership options for our best research available.
Bespoke Market Calendar — July 2020
Please click the image below to view our July 2020 market calendar. This calendar includes the S&P 500’s average percentage change and average intraday chart pattern for each trading day during the upcoming month. It also includes market holidays and options expiration dates plus the dates of key economic indicator releases. Start a two-week free trial to one of Bespoke’s three research levels.

B.I.G. Tips – Testing Uptrends
Chart of the Day – Confidence Grows
Bespoke Stock Scores — 6/30/20
Back to Average
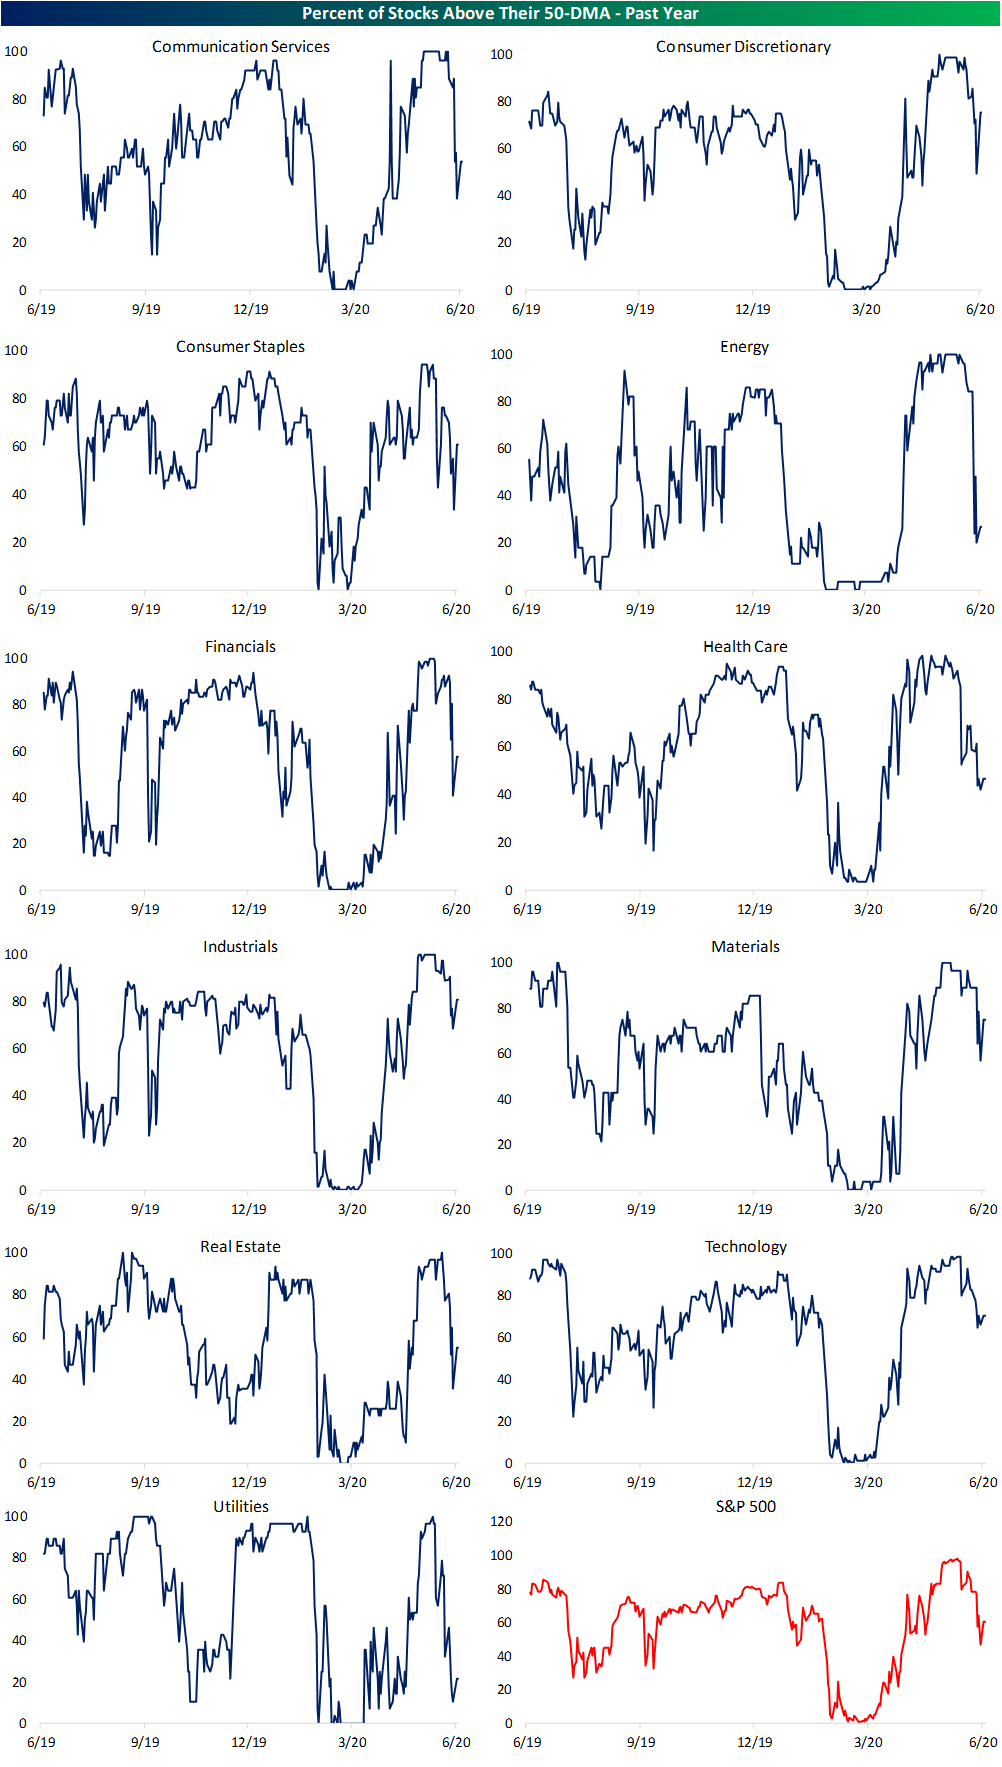
The S&P 500 is down just over 5.5% from its post bear market high set on June 8th. Just about every sector also set a high on that date with the exception of Communication Services (one day later on June 9th) and Technology who’s last high was as the most recent last Tuesday. At the time of those highs, each sector was deep in overbought territory as shown in the charts from our Daily Sector Snapshot below. But with each sector generally falling over the course of June, every sector is closing out the month in a more neutral area of their trading ranges with many hovering within a few percentage points of their 50-DMAs. At the moment, only the Technology sector remains overbought.

Most sectors are now within a few percentage points of their 50-DMAs, and that is a much more moderate reading than some observed in the past few months. As shown in the 50-DMA spread charts from our Daily Sector Snapshot below, the rally off the bear market lows saw some sectors like Energy and Industrials trade more than 20% above their 50-DMAs! For the broader S&P 500, the June 8th high also marked the most extended it got above its 50-DMA at 13.06%. Today that reading is a much more modest 2.33%.

As for the individual stocks within each sector, there has also been significant mean reversion. In the first couple of weeks of June, well over 90% of S&P 500 stocks were above their 50-DMAs. With equities broadly lower since the early month highs, only around 60% of stocks are now above their 50-DMAs. On a sector basis, Industrials have the highest share (80.8%) above while Utilities has the lowest share at only 21.43%. Click here to view Bespoke’s premium membership options for our best research available.