Service Sector Surges
Like many other data points of late, the ISM’s reading on the service sector saw a massive rebound in the month of June with the headline index rising to 57.1; well above estimates of a reading of 50.2. Coming in 6.9 points higher than forecasts, the only larger beat relative to expectations of all months since at least 2008 was back in March of this year when the headline index exceeded forecasts by 9.5 points. That returns the index to just about where it stood in February of this year (57.3). That was also the first expansionary reading (those above 50) since March.

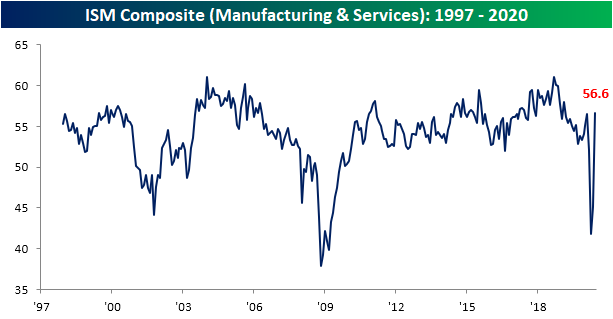
With today’s service sector release in combination with last Wednesday’s strong reading of the manufacturing counterpart, the ISM Composite reading is likewise right around the same levels as February. In fact, it is actually slightly higher at 56.6 in June compared to 56.5 in February earlier this year. That means June’s reading of 56.6 is the highest reading in the composite since February of 2019.
As shown in the table below, this month was a strong report across the board (albeit from low levels of activity); arguably even more so than last week’s Manufacturing report. Currently, almost every category is now showing an expansionary reading compared to only three doing so in May, one of which, Supplier Deliveries, was not necessarily a positive as it indicated supply chain issues. Looking at the June report, the only area of weakness in the sense that it is still showing a contractionary reading is that of employment. But even that index improved sharply month over month as was the case more broadly across each of the other categories. While employment remains on the weak side, the indices for Business Activity and Inventories are around some of their highest readings on record.
Not only is nearly every index now showing a healthier expansionary reading, but the monthly increases were massive. For the overall headline index as well as the manufacturing and services composite in addition to the indices for Business Activity, New Orders, Inventories, Employment, and Export Orders, June’s increases were the largest on record for each respective index. The only one without a notable move in the top (or bottom in the case of Supplier Deliveries) 5% of all month over month changes was for Inventory Sentiment.

The commentary section of the report backed up the data with respondents giving an overall tone of improved conditions with risks still very much in play. Those risks are not just in regards to COVID-19, though, as the election and political unrest were also quoted as material concerns among businesses.

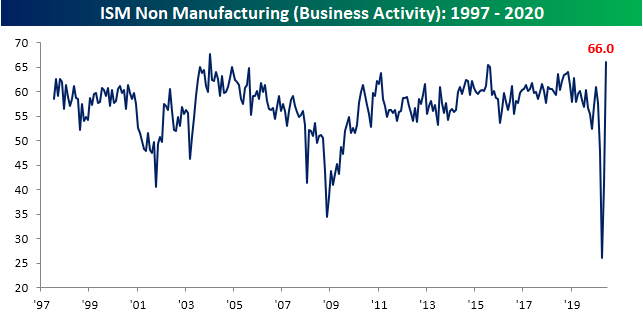
The index for Business Activity was perhaps one of the strongest areas of this month’s report. Coming in at 66 in June, it rose 25 points from May. That not only broke the record for the largest monthly gain of 15 points from just last month but also brings this index to its second-highest level for any month in the history of the report. The only higher reading came in January of 2004.
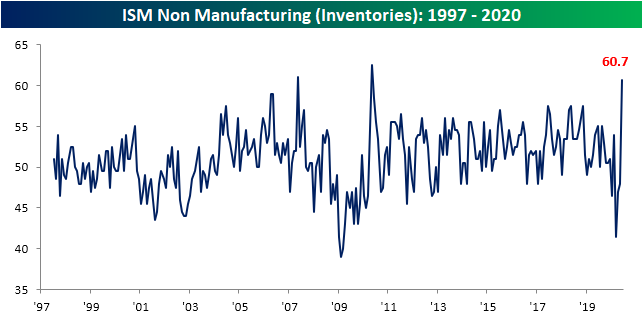
It is a similar story for the index for inventories which surged by 12.7 points to 60.7 in June. That was also the biggest increase on record surpassing a 9 point jump in March of 2007. This month’s reading of 60.7 is also now the third-highest reading on record behind May of 2007 and 2010’s readings of 61 and 62.5, respectively. That indicates businesses massively increased their inventories in June.
There are two likely reasons for businesses raising inventory levels. For starters, and as was noted in the commentary section, sales and overall demand have come back in a big way. New Orders rose by the most of any month on record with the index reaching 61.6. That is the highest level since February and in the upper end of the past few years’ range. Additionally, businesses can actually obtain inventories as disruptions in the supply chain seem to have been worked off. After surging to a record high 78.3 in April, the index for Supplier Deliveries fell for two consecutive months down to 57.5 in June. While that is still very elevated versus history (in the 94th percentile of all readings), it is a much healthier level than recent months with about half of companies reporting slower deliveries and the other half reporting faster deliveries. One comment in the report noted that “Delivery delays appear to have largely shaken out, and most products are becoming readily available with normal lead/shipping times”.


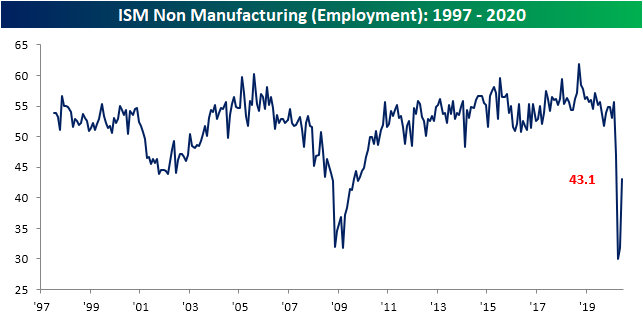
As mentioned above, the key area of weakness in the survey remains Employment. This index showed a fourth consecutive month of contractionary readings at 43.1 in June despite a record-sized increase of 11.3 points. In other words, even though other key areas of business are returning to normal, a higher share of businesses are still reporting lower levels of employment than higher. While still weak, even Employment is getting less worse. Roughly a quarter of responding businesses reported lower levels of employment compared to over 40% in April and May. Meanwhile, 16.1% reported an increase in June compared to 5.8% and 6.9% in April and May, respectively.
Finally, looking at the commodities section of the report, protective equipment and cleaning supplies remain in very high demand consistent with the manufacturing report while fuel products and steel have seen prices lower. Click here to view Bespoke’s premium membership options for our best research available.
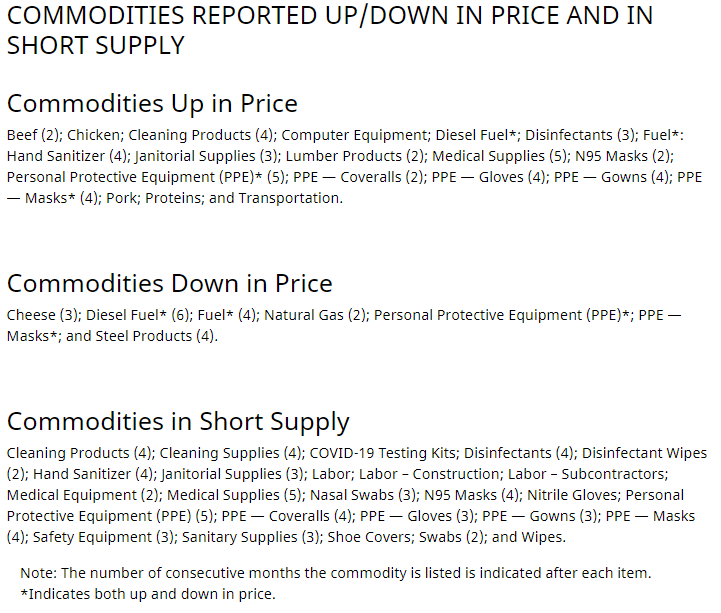
Chart of the Day: Always Bubbling China
New 2+ Year Highs for China’s Stock Market
Last Thursday we posted the charts below noting that China’s Shanghai Composite was on the cusp of a new 52-week high. Since Thursday, China has had two more trading sessions, and the Shanghai gained 2.01% on Friday and another 5.71% today. These gains not only left China’s equity market at a new 52-week high, but it’s now at its highest level since February 2018.
As shown in the second chart below of the last five years for the Shanghai Composite, the downtrend that had been in place since highs in 2015 is now firmly broken. The third chart of just the past year shows an index that has exploded higher over the last few days. Click here to view Bespoke’s premium membership options for our best research available.

Chinese Stocks Explode Higher
In last week’s Bespoke Report, we discussed what had at the time been an impressive rally in Chinese equities and noted that prior moves of that magnitude have typically been followed by additional gains. This week, Chinese equities continued to surge turning that ‘impressive’ rally into an extraordinary one. Today’s 5.7% rally in China’s CSI 300 Index has brought the 5-day change in the index up to 13.6%. Even by 2020 standards, that’s a big move.
The chart below shows the 5-day rate of change for the CSI 300 dating back to 2002. The current move ranks as the largest five-day move for the index since December 2014 and the 7th strongest five-day rally since 2002!

While the current rally is just the 7th strongest for the CSI 300, there have been quite a few more periods where the CSI 300 rallied more than 10% in five days, and in the chart below we highlight each of those periods with a red dot. Looking at these prior occurrences, they have come during all sorts of market environments. While there were occurrences right near both of the tops in 2007 and 2015, there were also occurrences in the run-ups to each of those peaks as well. Chinese stocks are notoriously volatile, and moves like the ones we have seen in the last week have historically occurred in all types of market environments. Click here to view Bespoke’s premium membership options for our best research available.

Bespoke’s Morning Lineup – 7/6/20 – Breaking Breadth Down
See what’s driving market performance around the world in today’s Morning Lineup. Bespoke’s Morning Lineup is the best way to start your trading day. Read it now by starting a two-week free trial to Bespoke Premium. CLICK HERE to learn more and start your free trial.
There’s no hangover on Wall Street this morning as futures are indicated more than 1% higher on optimism over global growth and a surge in Chinese equities. Since the equity market bottomed in March, today’s gap higher for the S&P 500 represents the 24th time that SPY has gapped up more than 1% at the open. In the prior 23 occurrences, the average change from the open to close was a gain of 0.34% (median: +0.38%) with gains 61% of the time. More recently, though, a 1%+ gap higher was met with selling intraday as the S&P 500 has declined from the open to close on each of the prior four occurrences.
Be sure to check out today’s Morning Lineup for a rundown of the latest stock-specific news of note, global and national trends related to the COVID-19 outbreak, and much more.

In this past weekend’s Bespoke Report, we provided a brief checkup on market breadth for both the S&P 500 and Nasdaq highlighting each index’s cumulative A/D line over the last year.
In the case of the S&P 500, breadth hasn’t been good or bad and has simply been tracking the overall direction of the index’s price level. Overall, breadth for the S&P 500 is neutral, and there’s nothing wrong with that.

For the Nasdaq, the picture isn’t as positive. As the Nasdaq Composite has made two higher highs in the last few weeks (dark blue line), the cumulative A/D line has actually been making lower highs. One reason for the weakness in the Nasdaq’s breadth is the relative weakness of small-cap stocks in the index.

Bespoke Brunch Reads: 7/5/20
Welcome to Bespoke Brunch Reads — a linkfest of the favorite things we read over the past week. The links are mostly market related, but there are some other interesting subjects covered as well. We hope you enjoy the food for thought as a supplement to the research we provide you during the week.
While you’re here, join Bespoke Premium for 3 months for just $95 with our 2020 Annual Outlook special offer.
COVID Wins
Emerging COVID-19 success story: Vietnam’s commitment to containment by Todd Pollack, Guy Thwaites, Maia Rabaa, Marc Choisy, Rogier van Door, Duong Huy Luong, Dang Quang Tan, Tran Dai Quang, Phung Cong Dinh, Ngu Duy Nghia, Tran Anh Tu, La Ngoc Quang, Nguyen Cong Khanh, Dang Duc Anh, Tran Nhu Duong, Sang Minh Le, and Thai Pham Quang (Our World In Data)
Aggressive quarantining, cheap and rapid testing, comprehensive contract tracing three degrees of separation out from confirmed cases, and other keys to Vietnamese victory against the COVID outbreak. [Link]
COVID Underdogs: Mongolia by Indi Samarajiva (Medium)
Mongolia has not only had no community transmission, but zero cases that were not directly (and often intentionally) imported from other countries. Here’s how the relatively poor but super-committed country managed to completely crush the virus. [Link]
COVID Fails
Party Guests Won’t Talk After 9 Test Positive. Now They Face Subpoenas. by Ed Shanahan (NYT)
A Rockland County house party with 100 attendees turned into a COVID hotspot, but various guests refused to talk to contact tracers. In response, local health authorities are issuing subpoenas which carry $2000 per day in penalties. [Link; soft paywall]
Only 1 in 5 isolating when COVID symptoms develop, King County says (KOMO)
King County (anchored by Seattle) is expanding its contract tracing team, but the results so far suggests an utterly depressing one-in-five people are not immediately isolating when they develop symptoms, keeping transmission chains intact. [Link]
New Models
Credentials Don’t Count on the Internet. Just Ask Nathan Tankus by Peter Coy (Bloomberg)
One of the newest entrants to the world of economics commentary is Nathan Tankus, a largely self-taught expert on the architecture of payments and monetary infrastructure, self-funds via an independent newsletter. [Link; soft paywall]
How Substack has spawned a new class of newsletter entrepreneurs by Steven Perlberg (Digiday)
Creatives are focusing on relatively modest but meaningful incomes that can be generated from their expertise in niche topics that have committed followings which traditional media might not pay attention to. [Link; soft paywall]
Alt Data
Traders thought Apple had ‘the holy grail’ of oil data, but the quest continues by Laura Sanicola (Reuters)
Apple’s release of real-time mobility data had potential to be a super-accurate gauge of how much Americans were driving, but the details the data presented didn’t turn out to be well-correlated to gasoline demand. [Link]
Tech
Deconstructing Pinterest’s reverse-image-search SEO growth hack by Ryan Bednar (RankScience)
Pinterest appears to have been using Google’s reverse image search feature to scrape and populate metadata for pictures uploaded to their site, which has the side effect (or intent, possibly) of boosting Pinterest content in Google rankings. [Link]
Tech’s Embrace of Remote Work Sends San Francisco Rents Plunging by Sophie Alexander (Bloomberg)
Apartment rental costs in San Francisco are plunging as tech workers decamp and the industry starts to fully embrace remote work as a result of the COVID pandemic. [Link; soft paywall, auto-playing video]
Economics
Balanced Sheets by Alex Williams (Phenomenal World)
A comprehensive book review and expansion upon Trade Wars Are Class Wars, a recent effort root global economics in the study of balance sheets rather than the traditional units of analysis that economists have used to describe output and activity. [Link]
China
China cuts Uighur births with IUDs, abortion, sterilization (AP)
A comprehensive summary of the slow-moving genocide underway in Xinjiang as China seeks to eliminate its large Muslim majority. [Link]
Read Bespoke’s most actionable market research by joining Bespoke Premium today! Get started here.
Have a great weekend!
Bullish Sentiment Below 25% for 3 Weeks
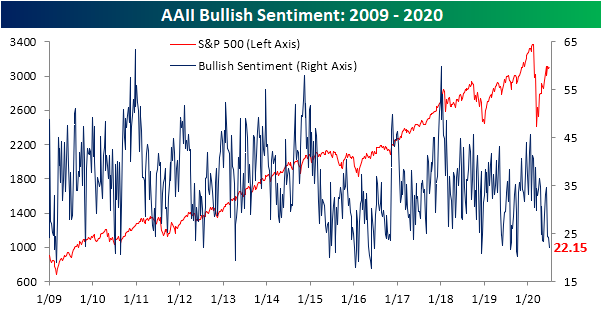
Despite generally positive price action over the past week, bullish sentiment has continued to take a hit. AAII’s sentiment survey saw just 22.15% of respondents report as optimistic for equities over the next six months. That is down for a fourth consecutive week and the third week in a row with less than a quarter of respondents reporting as bullish. That leaves bullish sentiment at its lowest level since October of last year when it fell to 20.31% and in the bottom 5% of all readings since the beginning of the survey in 1987.
As previously mentioned, less than a quarter of respondents have reported as bullish for three consecutive weeks now. As shown in the table below, there have not been many other occurrences of this since the start of the survey. In fact, there have only been 13 other times that bullish sentiment has been below 25% for three weeks or more without another occurrence in the prior 3 months. The last occurrence was in the spring of last year. Most of these streaks have ended at three weeks long, but there are some that have gone on for longer with the longest such streak being in 1990 when bullish sentiment remained below 25% for 9 straight weeks. Although this may indicate that investors hold a pessimistic outlook on the market, historically it has led to strong returns for equities. In prior periods where bullish sentiment has been below 25% for three weeks in a row the S&P 500 has tended to outperform over the following weeks, months, and years. Not only is there outperformance, but over the following 3, 6, and 12 months, the S&P 500 has not been lower even once.

Given that, it should not come as a surprise that many of those low bullish sentiment readings have come around market lows as shown in the charts below.

While bullish sentiment has continued to fall, not every investor has been outright bearish. Neutral sentiment rose to 31.96% this week, up 5 percentage points WoW. That was the largest one week jump in neutral sentiment since May of last year when it rose by over 8 percentage points.

Meanwhile, bearish sentiment was actually lower falling to 45.9% from 48.9% last week. Although lower, bearish sentiment is still fairly elevated in the 93rd percentile of all readings in the survey’s history. Click here to view Bespoke’s premium membership options for our best research available.

Bespoke’s Weekly Sector Snapshot — 7/2/20
The Bespoke Report – 7/2/20 – 100 Down, How Many to Go?
This week’s Bespoke Report newsletter is now available for members.
It looked like the market was going to finish out the week on a positive note, but a late-day sell-off erased much of the day’s earlier gains. Even after the decline, markets finished the day and the week in positive territory. While it was a short week, we have a lot to discuss in this week’s Bespoke Report.
Topics discussed include the strongest 100-day rally since 1933, a discussion of long and short-term performance trends in various asset classes, international equity market performance, still elevated levels of volatility, economic trends, sentiment, seasonal trends, and a lot more.
To read the report and access everything else Bespoke’s research platform has to offer, start a two-week free trial to one of our three membership levels. You won’t be disappointed!

Tesla Tops Toyota
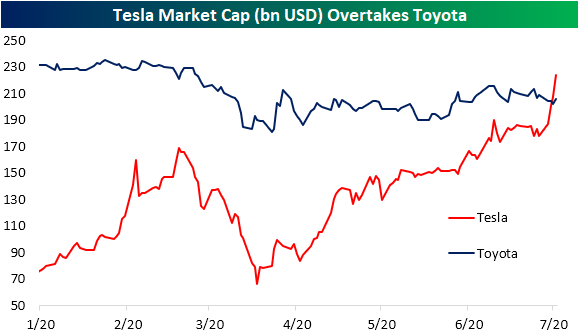
On Tuesday, Tesla (TSLA) reached the milestone of attaining a market cap of over $200 billion. Just one day later it tacked on another $7.5 billion in market cap surpassing Toyota for the highest valued global automobile manufacturer. With another boost today after the company reported a big beat on second-quarter deliveries (90.65K vs estimates of 72K), the stock is up at all-time highs crossing $1,200/share making for a market cap of $237 billion. Meanwhile, Toyota is valued at $205 billion in dollar adjusted terms. That makes TSLA the eleventh largest market cap in the Nasdaq 100.
As shown in the chart below, since Tesla IPOd just over a decade ago, it has consistently been taking up a greater share of the total market cap of global automobile makers. And in the past year, TSLA’s share has skyrocketed. TSLA now accounts for more than a quarter of the total market cap of the 19 largest automakers in the world. The only other automaker that has been able to boast that at any point since TSLA IPO’ed has been Toyota.

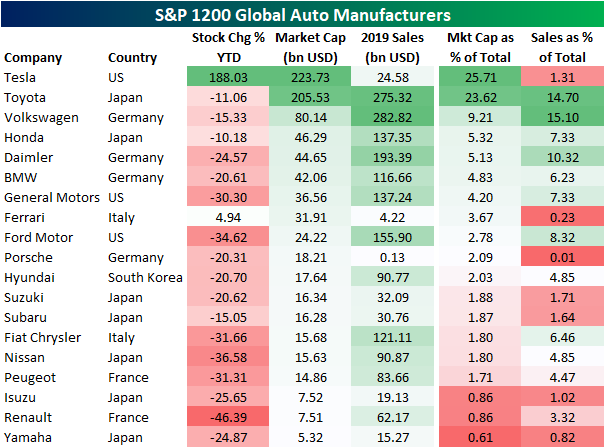
In the table below, we show all 18 stocks in the S&P 1200 Global Automobiles index in addition to Tesla and their YTD change, market caps, and 2019 sales as well as the latter two as a percentage of the total for the group. As shown, other than Tesla only Italy’s Ferrari is up on a YTD basis. But the two stocks’ performances are hardly comparable as TSLA has risen 188% and Ferrari has not even gained 5%. Even though both stocks are sitting in the green in 2020, they account for an extremely small share of global automobile revenues. The two companies combined still account for roughly 1.5% of total revenues of these companies. By comparison, Toyota who has the most similar market cap to Tesla accounts for 14.7% of all sales. Click here to view Bespoke’s premium membership options for our best research available.