What Have Democratic Sweeps Meant for the S&P 500?
Headed into the first presidential debate Tuesday night, betting markets (ElectionBettingOdds.com) placed Democratic candidate Joe Biden as the slight favorite to take the White House in November. The debate resulted in Biden gaining another 5 percentage point chance of winning the Presidency. As of this morning, Biden’s odds to win are at 59.8% versus Trump’s odds of 38.9%. Additionally, Democrats are slight favorites to win control of the Senate (58.4% to 41.5%) and big favorites to maintain the House (82.8% to 17.1%). Given these odds, in the chart below we show the average performance of the S&P 500 from the three months before Election Day through three months after Election Day for all election years post-WWII that resulted in a sweep of the executive and legislative branch by the Democrats.
As shown, on average the S&P 500 has been on the decline in the weeks leading up to Election Day, though in the days just before the Election there has been a small rally that sharply reverses once the results come in. After the initial post-Election drop, the market has trended a bit higher, but by three months after the Election, it has only found itself around the same levels as Election Day; on average a 2.6% loss versus where the index stood three months prior.
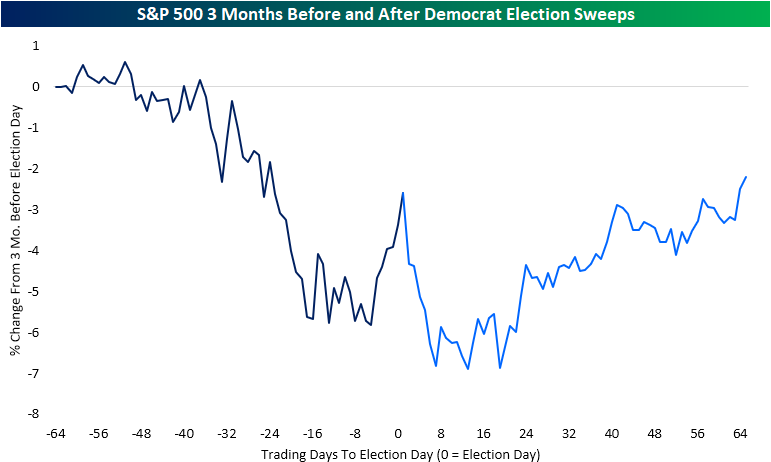
The composite shown above is comprised of six different years: 1948, 1960, 1964, 1976, 1992, and 2008. While on average the S&P 500 has traded lower, it is not necessarily a sure-fire thing. For example, 1948 and 2008 were the only years that saw the S&P 500 trade and stay significantly lower in the wake of the election. In 1976, there was similarly a sell-off in the immediate aftermath of the election, but the index did make its way back up to the highs of that six-month time frame later on albeit no new high was put in place. Meanwhile, 1960, 1964, and 1992 all saw the S&P 500 run higher after the election even despite some periods of consolidation after initial moves higher. In our B.I.G. Tips report from Tuesday, we show these same charts for all Presidential election years post WWII including a look at the average performance given every potential election outcome. Click here to see the report with a two-week free trial to Bespoke Premium.

Bespoke CNBC Appearance (9/29)
Bespoke co-founder Paul Hickey appeared on CNBC’s Closing Bell on Tuesday to discuss various market topics including the impact of the dollar on the performance of large-cap stocks. To view the segment, click the image below. Click here for a free trial to Bespoke’s research offerings and gain instant access to our latest market thoughts.

Chart of the Day: Third Time the Charm?
Bespoke’s Morning Lineup – 9/30/20 – They Did it Again
See what’s driving market performance around the world in today’s Morning Lineup. Bespoke’s Morning Lineup is the best way to start your trading day. Read it now by starting a two-week free trial to Bespoke Premium. CLICK HERE to learn more and start your free trial.
“Full of sound and fury, signifying nothing.” – Macbeth
In the markets and life in general, the most hyped events almost always fail to live up to expectations, and while last night’s debate was eagerly anticipated, it was a big disappointment that devolved into shouting and name-calling devoid of any substance. The seven words from Macbeth summed it up best.
In other news this morning, ADP Employment topped expectations by 100K (749K vs 649K), and the Chicago PMI was so strong that they released it early (62.4 vs 52.0 expected). The second revision to Q2 GDP also came in slightly less disastrous than expected (-31.4% vs -31.7%).

The initial reaction to last night’s debates in the betting markets was clearly in Biden’s favor. Over at electionbettingodds.com, the odds for Biden to win the November election jumped back nearly to new highs after rising 4.9 percentage points in the last day to just under 60%. Trump’s odds, conversely, dropped more than four points to below 40%.

Daily Sector Snapshot — 9/29/20
Bespoke Stock Scores — 9/29/20
B.I.G. Tips – S&P 500 Surrounding The Election
Chart of the Day: Brimming With Confidence
Global Activity Still Bouncing Back, But Remains In A Hole
Overnight we got a bunch of cyclical data that is helpful in showing where the global economy currently sits across regions and categories, similar to Markit PMIs.
Korea, Sweden, and the Eurozone all released indices of manufacturing and services sector sentiment that are not directly comparable on a like-for-like basis (as is the case with Markit PMIs) but do tend to send similar messages about the state of the global economy. We show them in the chart below, presented as a Z-score (current reading less average, measured in standard deviations) which normalizes them for their volatility and to the same scale.
As shown, economic activity continues to bounce broadly from the extreme lows of Q2, but September readings are still generally well below the pre-COVID norm and are below average. Similar to the US economy, global activity is still bouncing, but is far from pre-COVID levels in our view. This analysis was originally published in our pre-open report — The Morning Lineup — this morning. Click here to start a free trial to Bespoke Institutional and receive our daily Morning Lineup for the next two weeks, featuring more commentary and data on macro markets.

Fed Speak Surges
There are six scheduled Fed speakers today, including multiple appearances from Governor Quarles. That’s a lot to keep track of and it may feel like that’s the new normal after an absolute deluge of public comments from FOMC members following the introduction of their new long-term monetary policy strategy in September and more detail around its implementation at the September policy meeting. The result is a record number of headlines from FOMC members. By our count, based on actual public appearances through September 28th and scheduled appearances the rest of the week, the two weeks ending Thursday will have been the busiest slate of Fed speakers since we began tracking all public comments from the FOMC in mid-2017.
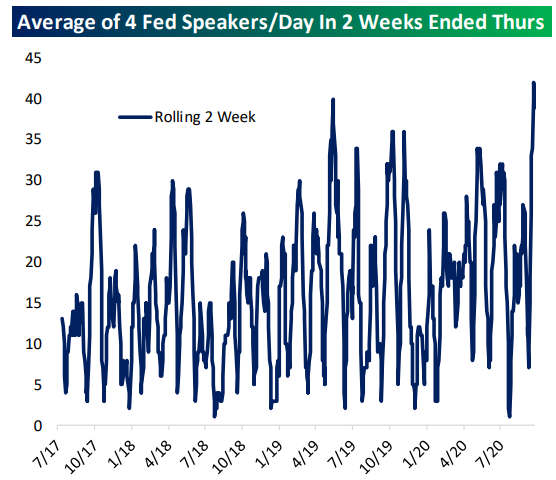
As for what they’ve been saying, we note two themes: first, outright dovishness about the outlook, but also an insistence that more fiscal policy is necessary even as more and more members of the FOMC come to the realization that there won’t be any more fiscal support until next year. As shown below, using our rolling 20-speech average assessment, we grade the recent run of Fed speakers as one of the most dovish since our tracking began. For a full summary of all speeches, make sure to check out our Fedspeak Monitor, which is regularly updated with brief summaries of FOMC comments (and links to their full speeches when possible). This analysis was originally published in our post-market macro report — The Closer — last night. Click here to start a free trial to Bespoke Institutional and receive our nightly Closer for the next two weeks, featuring more commentary and data on macro markets.
