Chart of the Day: Analysts Playing Catch-Up
Bespoke Matrix of Economic Indicators – 8/3/20
Our Matrix of Economic Indicators is the perfect summary analysis of the US economy’s momentum. We combine trends across the dozens and dozens of economic indicators in various categories like manufacturing, employment, housing, the consumer, and inflation to provide a directional overview of the economy.
To access our newest Matrix of Economic Indicators, start a two-week free trial to either Bespoke Premium or Bespoke Institutional now!

July 2020 Headlines
Production Popping Without People
This morning’s ISM report on the manufacturing sector indicated continued improvements in the month of July. July’s rise in the headline number to 54.2 from 52.6 marked back to back months with expansionary readings for the first time since January and February of this year. It was also a third consecutive month in which the index has risen. That leaves it at its highest level since March of last year.

Most of the sub-indices of the report are likewise now showing expansionary readings. As shown below, most indices have seen continued improvements with the increases in July being in the upper quartile of historic readings; many of these were actually in the upper decile. Nearly every index is now showing expansionary readings with Backlog Orders, Export Orders, and Import Orders all rising above 50 in July. At the moment, the only indices to remain in contraction are those for inventories and employment. These are also at the lower end of their historical ranges. For the indices for inventories, the contractionary readings are not necessarily a glaring negative though as they come off of expansionary readings (rising inventories) in recent months.

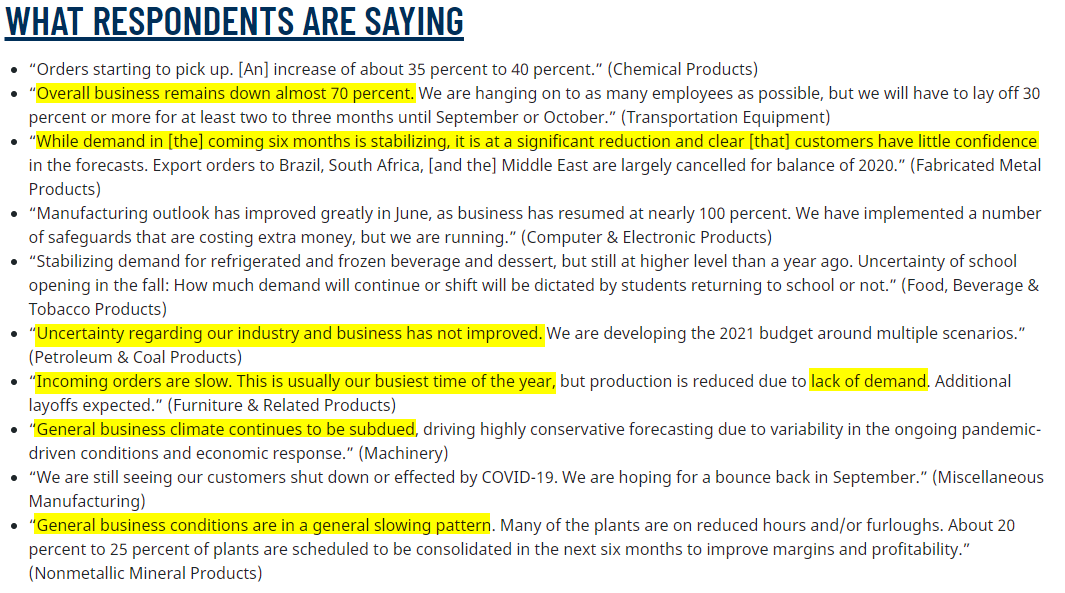
Although the numbers are providing a fairly optimistic outlook for the country’s manufacturing sector, more anecdotally, the comments in this month’s survey had a decent amount of negativity. As shown below, several comments made mention that even if improved, demand is still down dramatically and uncertainty remains higher. On the other hand, some respondents like one from the Computer & Electronic Products industry and the Food, Beverage, & Tobacco Products industry are reporting that demand has either returned to normal or is better than a year ago.
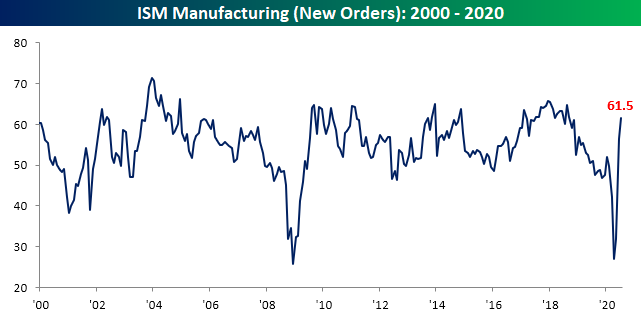
Increased demand, and as a result increased production, has been a major boost to the headline number. As shown below, the index for New Orders saw another huge increase in July rising 5.1 points to 61.5. Excluding last month’s extreme rise of 24.6 points, which was the largest monthly gain on record, you would have to go all the way back to July of 2013 to find another time that the index for New Orders rose by more. That leaves the index at its highest level since September 2018 while the index for Production is at its highest level since August 2018. Those improved conditions also appear to be fairly broad with 13 of the 18 industries surveyed reporting growth in new orders and 16 of the 18 reporting growth in production; no industry reported a decrease in production in July.

Stronger demand certainly seems to be the reason for that higher production. Over the past two months, inventories have been building as demand was bouncing back. This month’s reading of 47 indicated that reversed as inventories began to be drawn upon. Meanwhile, as New Orders pickup, order backlogs are rising for the first time since February. That was the only other month since April of last year in which order backlogs were rising. The index for Backlog Orders is now at its highest level since April of 2019.


Although production and demand has picked up, employment has been left behind. In other words, businesses appear to be ramping up output without the help of additional labor. Granted, that could change as production continues to pick up. Of the 18 manufacturing indices, ten reported a decrease in employment (again many of these also reported an increase in production) while only five reported growth: Apparel, Printing and Related Support Activities, Furniture, Plastic and Rubber, and Computer and Electronic Products. While improved from the past few months, the index for employment remains low at 44.3. Click here to view Bespoke’s premium membership options for our best research available.


Bespoke’s Morning Lineup – 8/3/20 – They Know Nothing!
See what’s driving market performance around the world in today’s Morning Lineup. Bespoke’s Morning Lineup is the best way to start your trading day. Read it now by starting a two-week free trial to Bespoke Premium. CLICK HERE to learn more and start your free trial.
Quote of the Day: “I have talked to the heads of almost every single one of these firms in the last 72 hours, and Ben Bernanke has no idea what it’s like out there. None. And Former St. Louis Fed. President Bill Poole has no idea what it’s like out there. My people have been in this game for 25 years and they’re losing their jobs, and these firms are going to go out of business, and he’s nuts! They’re nuts! They know nothing! … This is a different kind of market, and the Fed is asleep.” – Jim Cramer 8/3/07
We’ve got no cases of “the Mondays” to deal with this morning as US equity futures have been rallying all morning and trade near their highs of the session on positive economic data out of Europe (first expansionary manufacturing PMI reading in 18 months) and a slowing of Covid cases in the US. The S&P 500 is poised to open at levels it hasn’t traded at since 2/24, while the Nasdaq is indicated to open up just under 1%. That may sound like a good move for the Nasdaq, but keep in mind that the index has rallied more than 1% on seven of the last eight Mondays. That’s impressive!
Be sure to check out today’s Morning Lineup for a rundown of the latest stock-specific news of note, key earnings and economic news in Europe and the US, trends related to the COVID-19 outbreak, and much more.

The Fed may have been asleep back in August 2007, but they have gone out of their way to not make the same mistake this time around. The floodgates have been busted wide open with liquidity. At the time of Jim Cramer’s rant thirteen years ago today, the Fed Funds rate was over 5%. Today, it’s not only at zero, but the Fed has been actively purchasing government, agency, and corporate debt. The Fed of 13 years ago was downright prudish compared to the Fed today.
Cramer’s rant also came right near the market peak and was quickly followed by one of the largest equity drawdowns in US stock market history. By March 2009, the S&P 500 was down more than 50% as much in the way of personal retirement savings, many banks and corporations, and the entire financial system were nearly wiped out.
In the stock market, though, time often acts as the best elixir. It took four years for investors to get back to even from the time of Cramer’s now-famous comments. Longer-term, though, investors have been rewarded for staying the course. Through last Friday, the S&P 500 was up just under 200% versus where it was 13 years ago, and on an annualized basis, that works out to over 8.5%.

Bespoke Brunch Reads: 8/2/20
Welcome to Bespoke Brunch Reads — a linkfest of the favorite things we read over the past week. The links are mostly market related, but there are some other interesting subjects covered as well. We hope you enjoy the food for thought as a supplement to the research we provide you during the week.
While you’re here, join Bespoke Premium with a 30-day free trial!
What Could Go Wrong
Researchers revive bacteria from the era of the dinosaurs (The Economist)
Using novel techniques, scientists have extracted bacteria from a layer of sediment at the bottom of the sea. Bacteria are part of “marine snow”, trapping beneath them older bacteria deposited from the part of the ocean closer to the sun. [Link; soft paywall]
Domino’s New Zealand drops ‘free pizza for Karen’ offer after backlash (BBC)
In a misguided effort to appeal to all the Karens out there, Dominos’ New Zealand and Australia division tried to “reclaim” that name used to describe racist middle-aged white women. The results were predictably quite bad. [Link]
Manhattan DA Made Google Give Up Information on Everyone in Area as They Hunted for Antifa by Albert Fox Cahn (The Daily Beast)
The Manhattan DA is using a novel technique to identify anti-fascist protestors from a conflict outside the Manhattan Republican Club last October. “Reverse search warrants” turn the very concept of a search warrant on its head, seeking to identify everyone fitting a condition rather than limiting government access to specific, factually-supported intrusion into what would otherwise be private spaces. Broader use of this technique would be a huge challenge to civil liberties in general. [Link]
Homes Is Where The Heart Is
RV shipments surge as Americans opt to carry home with them to avoid airports, hotels by Timothy Aeppel (Reuters)
While airplanes can be dangerous transmission zones if flyers don’t wear masks, and hotels create lots of contacts with the potentially infected, an RV is a safe zone that allows for comfortable travel without any concern about catching coronavirus. [Link]
The Cold War Bunker That Became Home To A Dark-Web Empire (The New Yorker)
A cold war bunker went on the market for €350,00 in 2012, and was eventually picked up by one of the stranger characters the 90s tech-utopian period ever produced in order to host whatever customers wanted to put online. [Link; soft paywall]
Norms Come, Norms Go
Americans are getting more nervous about what they say in public (The Economist)
While free speech absolutists may cringe at the notion that people should be careful with their words lest they hurt those listening, Americans appear to be feeling a bit more considerate when it comes to voicing their political views. [Link; soft paywall]
‘Hey, You Free on Friday for a Meeting and a Bank Heist?’ by David Segal (NYT)
Virtual meeting places are expanding from the boredom of Zoom calls into the drama and excitement of video games; clients and the firms catering to them have fled into that space for the same reasons they used to go to bars or restaurants together instead of just meeting rooms. [Link; soft paywall]
MacKenzie Scott Donates $1.7 Billion to Charity Within Months by Sophie Alexander (Bloomberg)
The world’s 13th-richest person, MacKenzie Scott, has donated 2.8% of her net worth to charities that promote racial equity, fight climate change, and protect public health. [Link; soft paywall]
COVID
Herd Immunity May Be Developing in Mumbai’s Poorest Areas by Ari Altstedter and Dhwani Pandya (Bloomberg)
More than half of Indians living in some of the largest slums around Mumbai show antibodies for COVID-19, suggesting that those populations are nearing herd immunity for the pandemic; estimates of where that broad level of protection kicks in are around 80% and higher. [Link; auto-playing video, soft paywall]
A national teachers’ union says its members can strike to ensure schools reopen safely. (NYT)
The second-largest teachers’ union said this week that they would support strikes in districts or states that moved to reopen classrooms without safety protocols in place. [Link; soft paywall]
Covid-19 infections leave an impact on the heart, raising concerns about lasting damage by Elizabeth Cooney (Stat News)
A pair of German studies identified significant damage to COVID patients hearts after recovery (including high prevalence of biomarkers that are present after a heart attack) and significant levels of the virus in the hearts of deceased patients. [Link]
Stocks
When Tesla Hits the S&P 500, It’ll Spark the Wildest Passive Trade Ever by Sarah Ponczek (Bloomberg)
It’s uncommon for very high market cap stocks to be added to the S&P 500, but Tesla fits the bill after reporting four consecutive quarters of positive net income with its most recent quarterly release; its addition to the index could spark some pretty wild trading. [Link; soft paywall]
Dumb Money Making Smart Stock Picks in Yearlong Robinhood Rally by Vildana Hajric and Saraha Ponczek (Bloomberg)
Data suggests that Robinhood investors are basically the opposite of the “dumb money” tropes which are typically used to describe high frequency retail trading. [Link; soft paywall]
Coal
Falling giants: Britain’s vanishing cooling towers by Michael Collins (FT)
Coal cooling towers (also associated with nuclear power plants) have become a less common part of the national landscape in Europe as the continent has shifted away from that form of electricity. [Link; paywall]
Europe steams towards coal exit – research by Isla Binnie (Reuters)
The drop in electricity demand brought on by COVID has expedited a plunge in the volume of coal burned at power plants, with renewable sources now producing 40% of EU electricity. [Link]
Future Forecasts
Everybody’s An Expert by Louis Menand (The New Yorker)
The science of prediction is somewhat loose, but it does suggest that there are many ways to make mistakes with too much expertise. [Link; soft paywall]
Read Bespoke’s most actionable market research by joining Bespoke Premium today! Get started here.
Have a great weekend!
The Bespoke Report — A False Act?
This week’s Bespoke Report newsletter is now available for members.
Just when they thought Tech was out, they pulled it back in!
Since peaking on July 20th, the Tech sector and FAANG names had been experiencing some downside mean reversion. That downside action came to an end on Friday when Apple (AAPL), Amazon (AMZN), and Facebook (FB) all surged on extremely impressive earnings results.
Below is one chart from this week’s Bespoke Report that shows the strength we’ve seen from the mega-caps in 2020. As shown, the five largest stocks in the S&P 500 have collectively added $1.66 trillion in market cap this year. The other 495 stocks in the index have lost $1.61 trillion in market cap!
We discuss this week’s action across financial markets in our weekly Bespoke Report newsletter. To read the report and access everything else Bespoke’s research platform has to offer, start a two-week free trial to one of our three membership levels. You won’t be disappointed!


Daily Sector Snapshot — 7/31/20
B.I.G. Tips – CAT Clipped
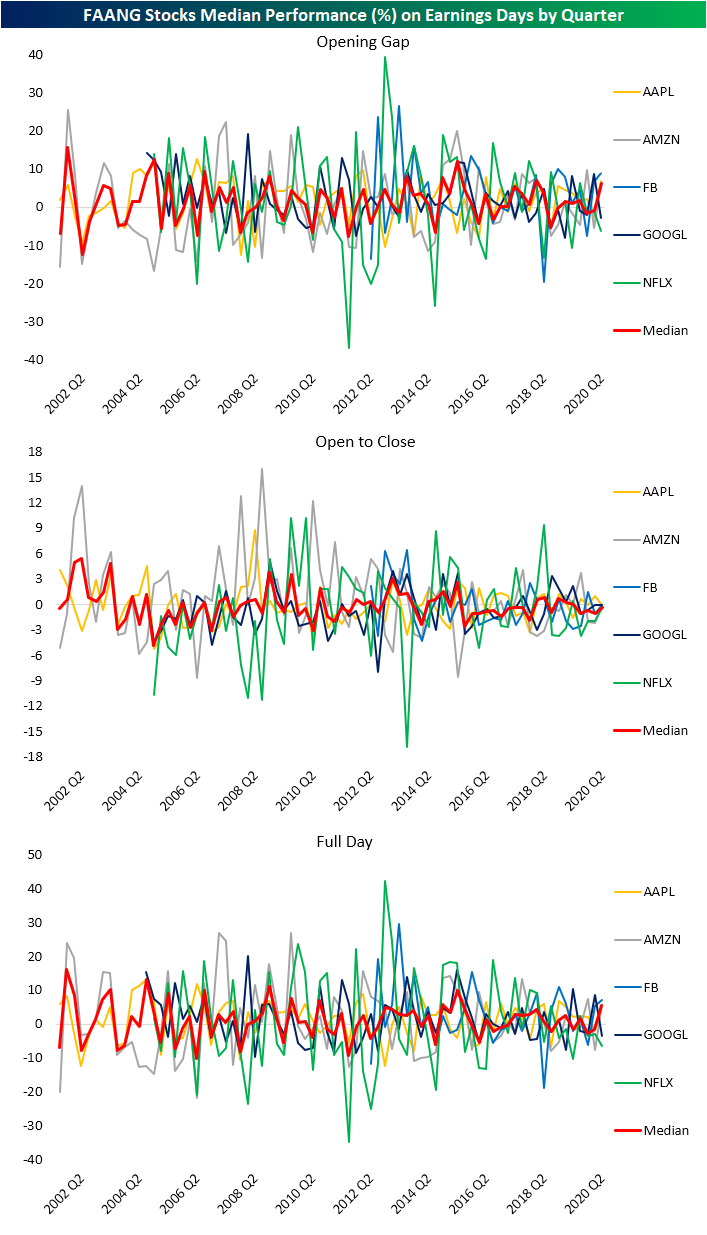
FAANG Flying on Earnings
Earlier this month, Netflix (NFLX) reported a disappointing quarter with EPS missing estimates by 24 cents which led the stock to fall 6.52% on its earnings reaction day. The rest of the FAANG group—Facebook (FB), Apple (AAPL), Amazon (AMZN), and Alphabet (GOOGL)—all reported their second-quarter results last night which we discussed in the Closer. With the exception of GOOGL, the results were very strong. Despite beating top and bottom-line estimates by $954.65 million and $1.9/share, respectively, GOOGL’s revenues were lower year over year for the first time ever and that has the stock lower today. The rest of the group beat estimates, and Amazon (AMZN) even reported a triple play for the first time in over a decade. The last triple play by AMZN was in January of 2010 back when the company’s market cap was ~$54 billion; roughly 3.4% of its current market cap over $1.59 trillion. In fact, at the open today, AMZN added more in market cap than it’s entire market cap back then.
Given the strong earnings, these stocks are flying today. In fact, Apple, Facebook, and Amazon all gapped up over 5% this morning, and as of this writing, AMZN is the only one to have pared some of those gains currently trading just over 3.8% higher on the day. In the charts below, we show how each of the FAANG stocks has performed on earnings days across each quarter in our Earnings Explorer database. On a median basis, this quarter is looking to be the best in terms of full-day performance (based on where they are trading intraday) of FAANG stocks on earnings days since Q1 2018 while the median opening gap of 6.2% is the quarter best since Q2 2015. This quarter also marked the first time since Q1 of 2018 that at least 3 FAANG stocks all gapped up over 5%. If AMZN, moves back above a 5% gain on the day, it would be the first time since Q2 of 2015 that at least three FAANG stocks rose 5%+ on their earnings reaction days.
Of the specific stocks, Facebook’s reaction today is looking to be its best earnings reaction day since January 2019 (10.82%). For Amazon (AMZN), it is the best Q2 earnings reaction day since 2015, but back in January of this year, the stock saw a much larger 7.38% gain in response to Q4 earnings. For Apple, the pop on earnings is looking like it will the stock’s best earnings reaction day since January of 2019 when it gained 6.8%. Click here to view Bespoke’s premium membership options for our best research available.